Fundamentals of time series data
Time Series Analysis in Power BI

Kevin Barlow
Data Analytics Professional
Why is it important?
Every dataset has time as a dimension! We can learn some very interesting trends from analyzing data over time, and we need a strong toolkit to do so.
- How has my data changed over time?
- What should my data show based on history?
- What will my data show in the future?

Defining time series data

Tracking changes over time
Secular Variation

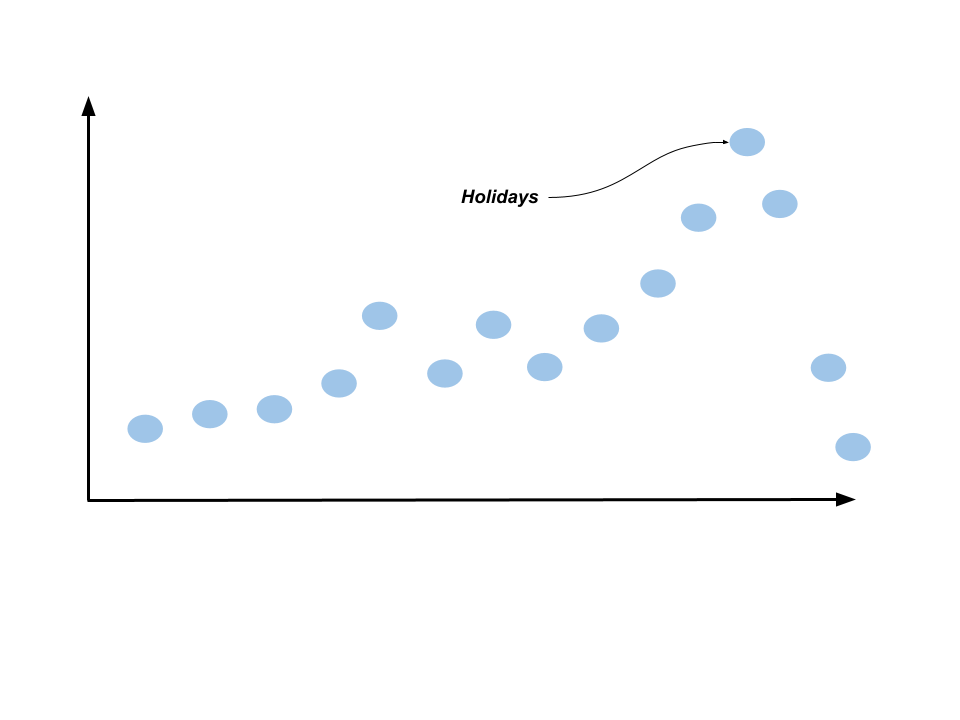
Seasonal Variation

Cyclical Variation
Random (Irregular) Variation

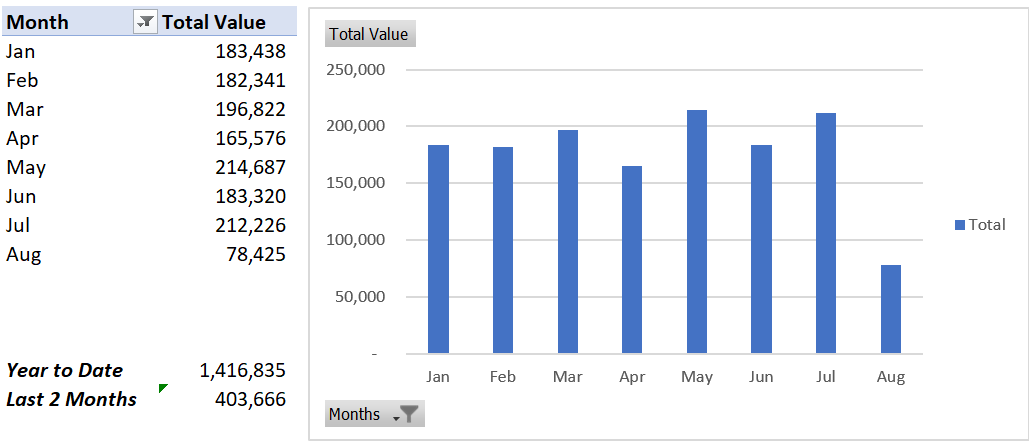
Short term time series analysis
Example
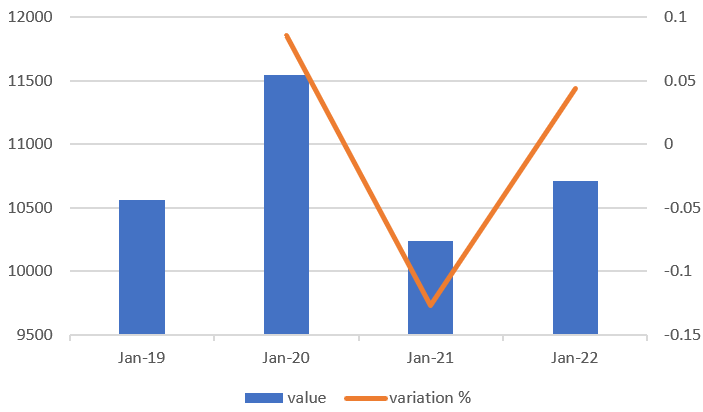
Long term time series analysis
Example Calculating Year over Year (YoY) sales performance for the month of January.
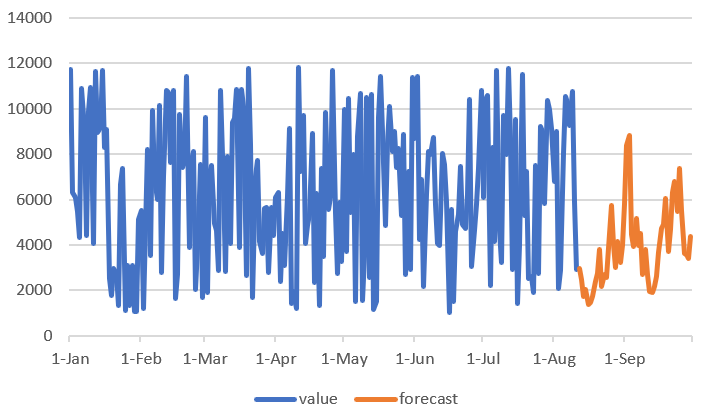
Forecasting the future
Example
Forecasting stock trade volume several months into the future.