Forecasting in Power BI
Time Series Analysis in Power BI

Kevin Barlow
Data Analytics Professional
Context and importance
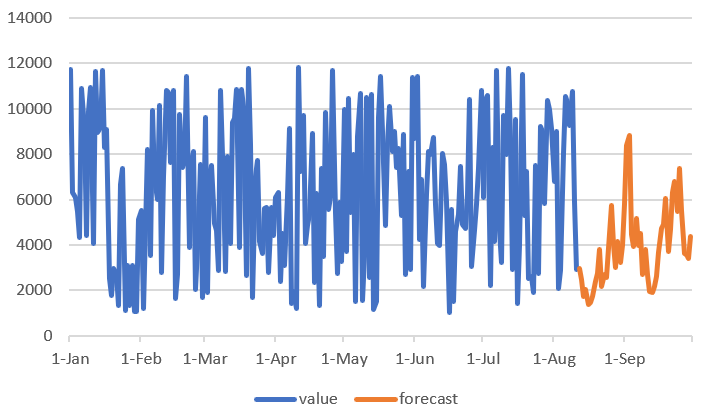
Forecasting messy data
Confidence in forecasts

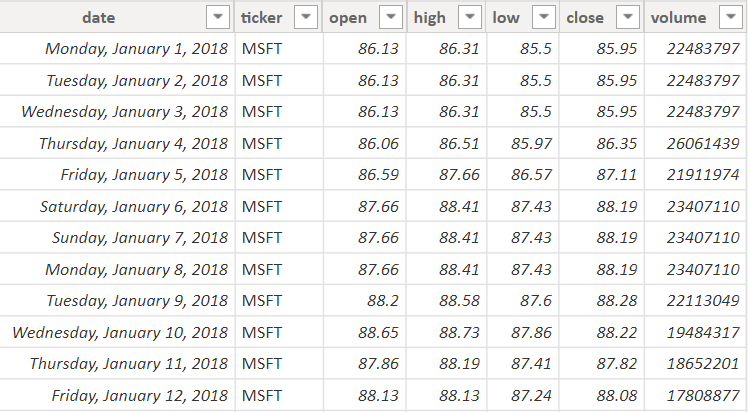
Stock dataset
We will practice forecasting on some stock data for Microsoft (ticker: MSFT). The data includes basic information on the stock's trading price on a given day.