Data cleaning and exploratory analysis
A/B Testing in Python

Moe Lotfy, PhD
Principal Data Science Manager
EDA plotting
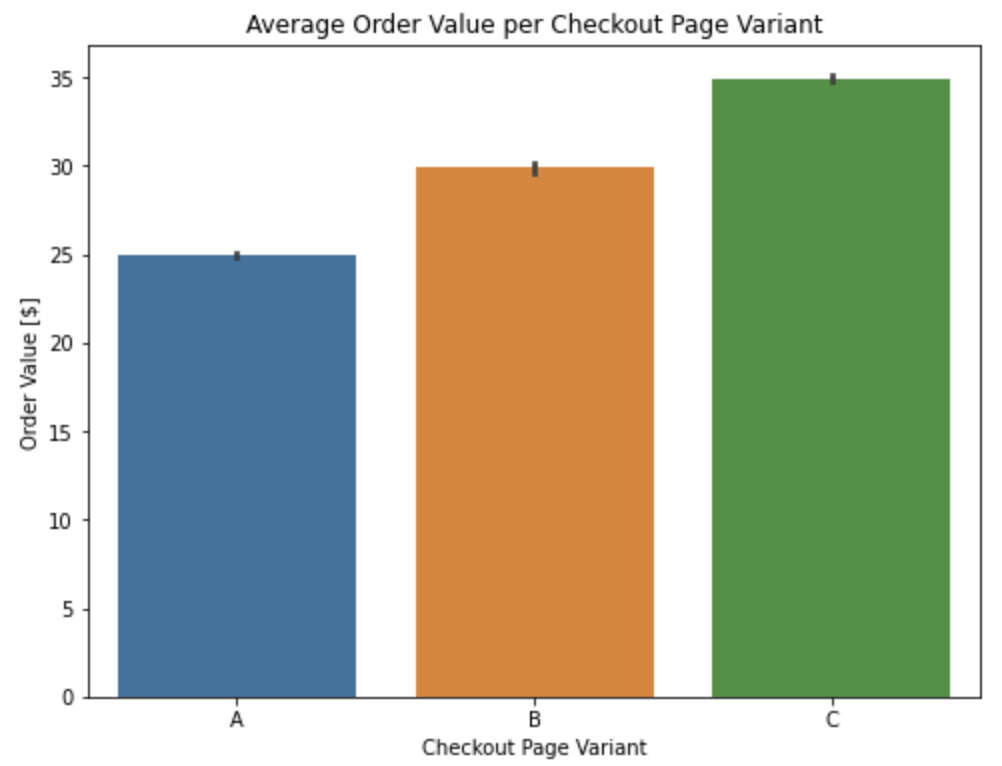
- Bar plots
sns.barplot(x=checkout['checkout_page'], y=checkout['order_value'], estimator=np.mean)
plt.title('Average Order Value per Checkout Page Variant')
plt.xlabel('Checkout Page Variant')
plt.ylabel('Order Value [$]')
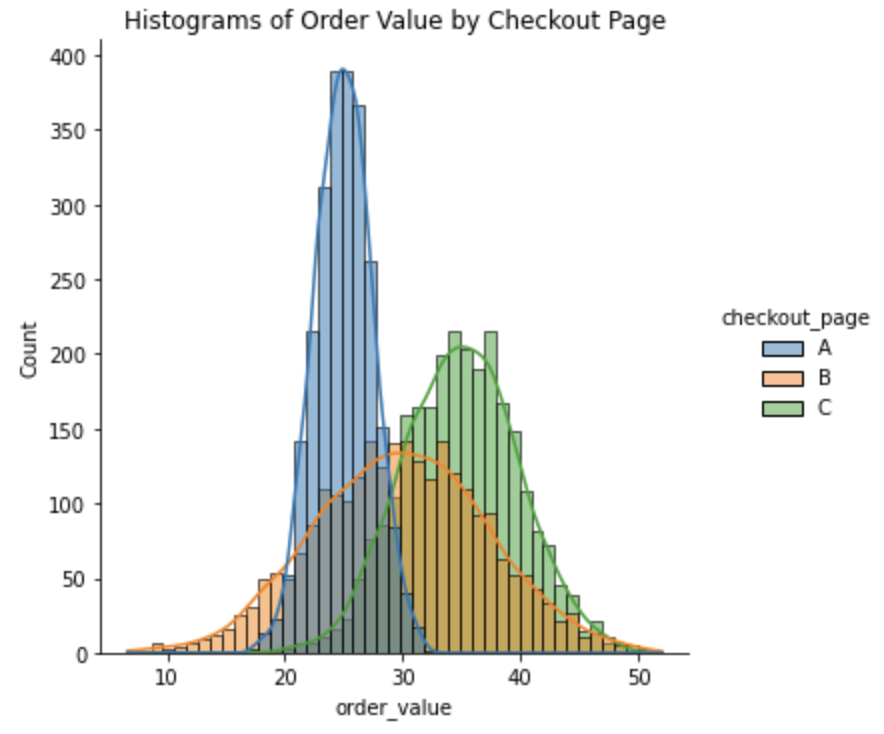
EDA plotting
- Histograms
sns.displot(data=checkout, x='order_value', hue = 'checkout_page', kde=True)
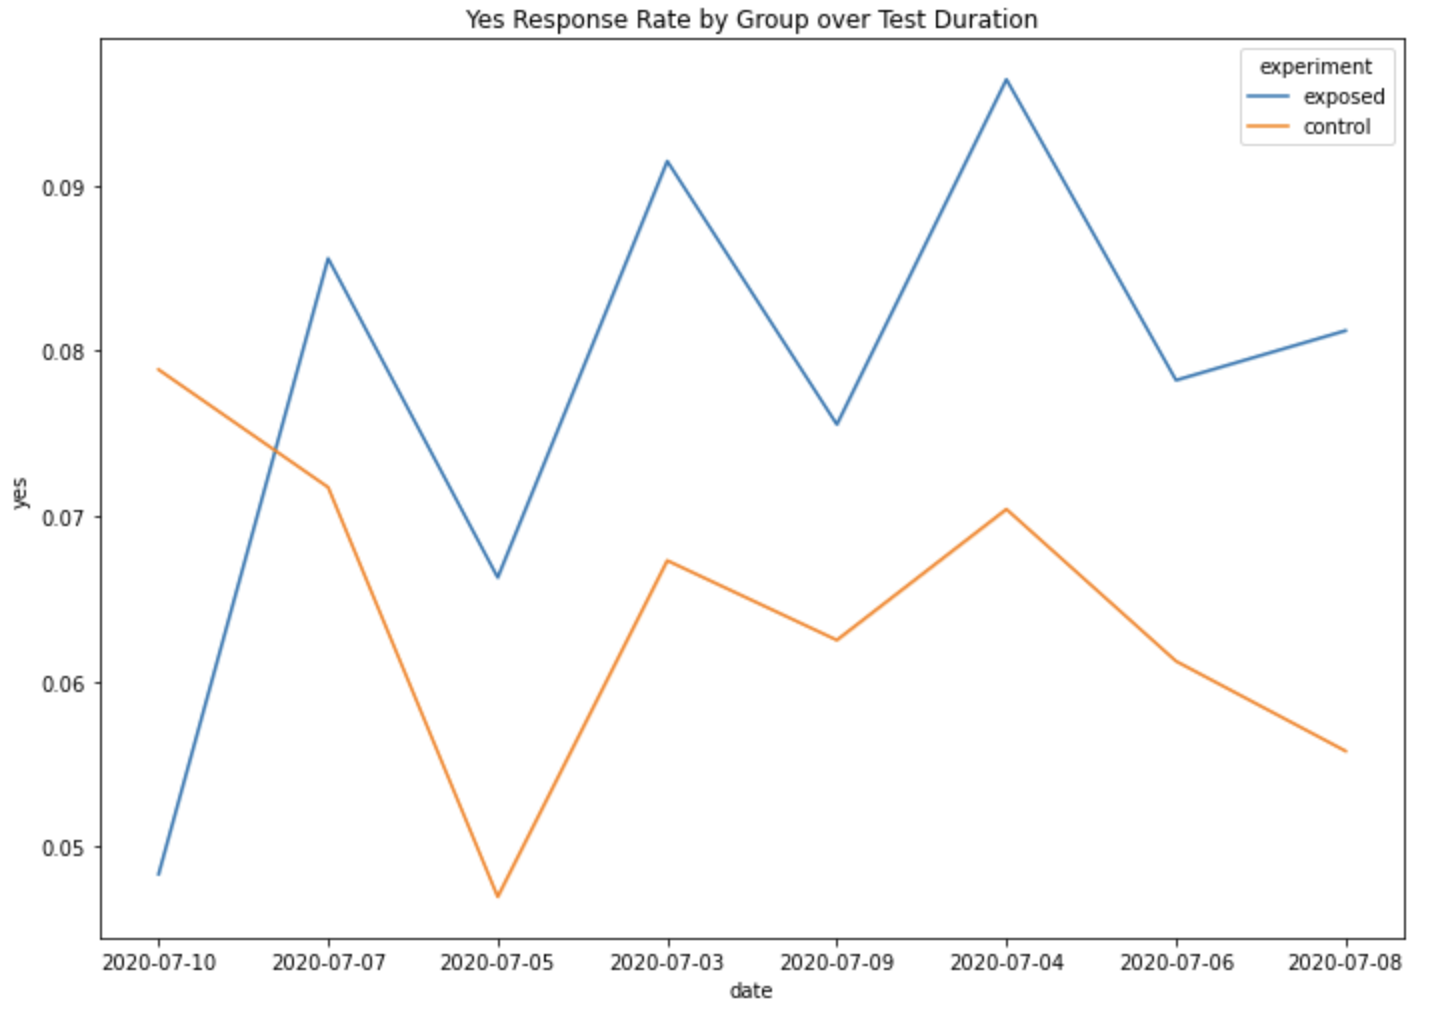
EDA plotting
- Time series (line plots)
sns.lineplot(data=AdSmart,x='date', y='yes', hue='experiment', errorbar=None)
1 Adsmart Kaggle dataset: https://www.kaggle.com/datasets/osuolaleemmanuel/ad-ab-testing

