Hypothesis formulation and distributions
A/B Testing in Python

Moe Lotfy, PhD
Principal Data Science Manager
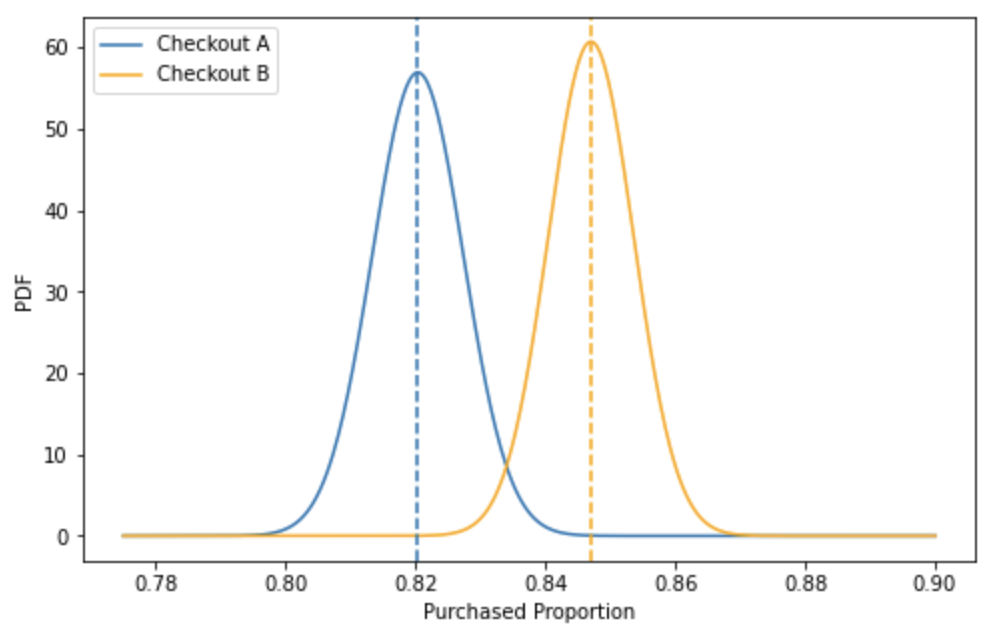
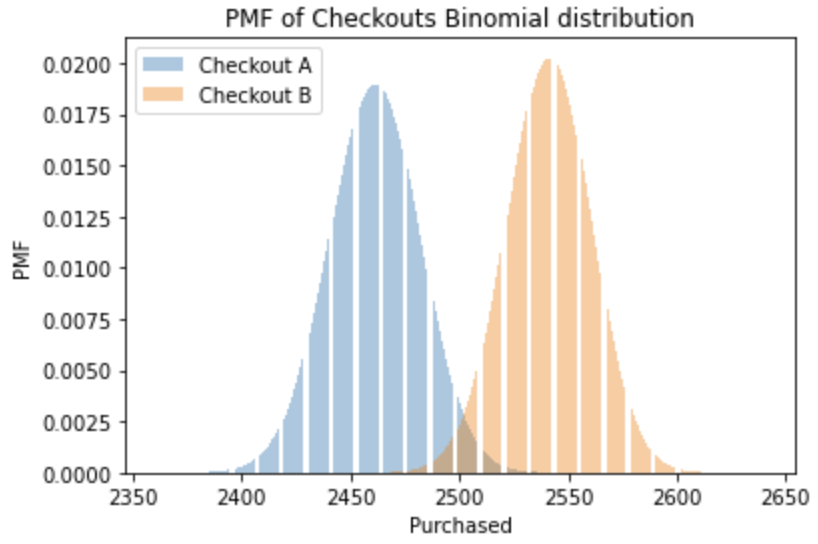
Simulating and plotting distributions
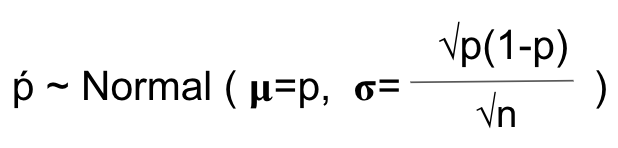
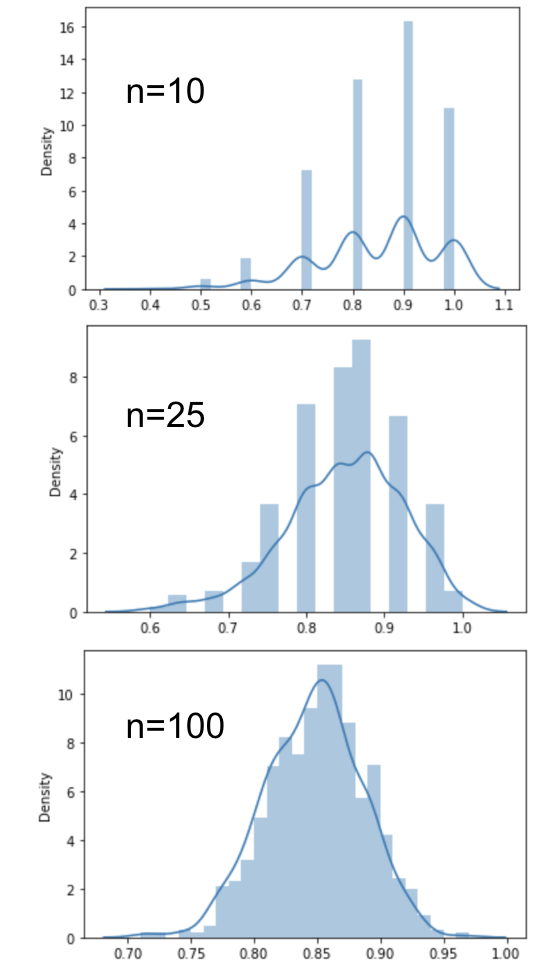
Central limit theorem
For a sufficiently large sample size, the distribution of the sample means, p, will be
- normally distributed around the true population mean
- with a standard deviation = standard error of the mean
- irrespective of the distribution of the underlying data
Central limit theorem in python
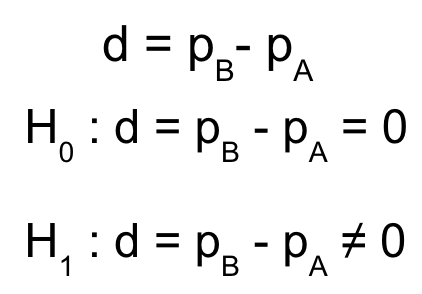
Hypothesis mathematical representation