International equity portfolio

Quantitative Risk Management in R

Alexander McNeil

Instructor

International equity portfolio

  • Imagine a UK investor who has invested her wealth:
    • 30% FTSE, 40% S&P 500, 30% SMI
  • 5 risk factors: FTSE, S&P 500 and SMI indexes, GBP/USD and GBP/CHF exchange rate
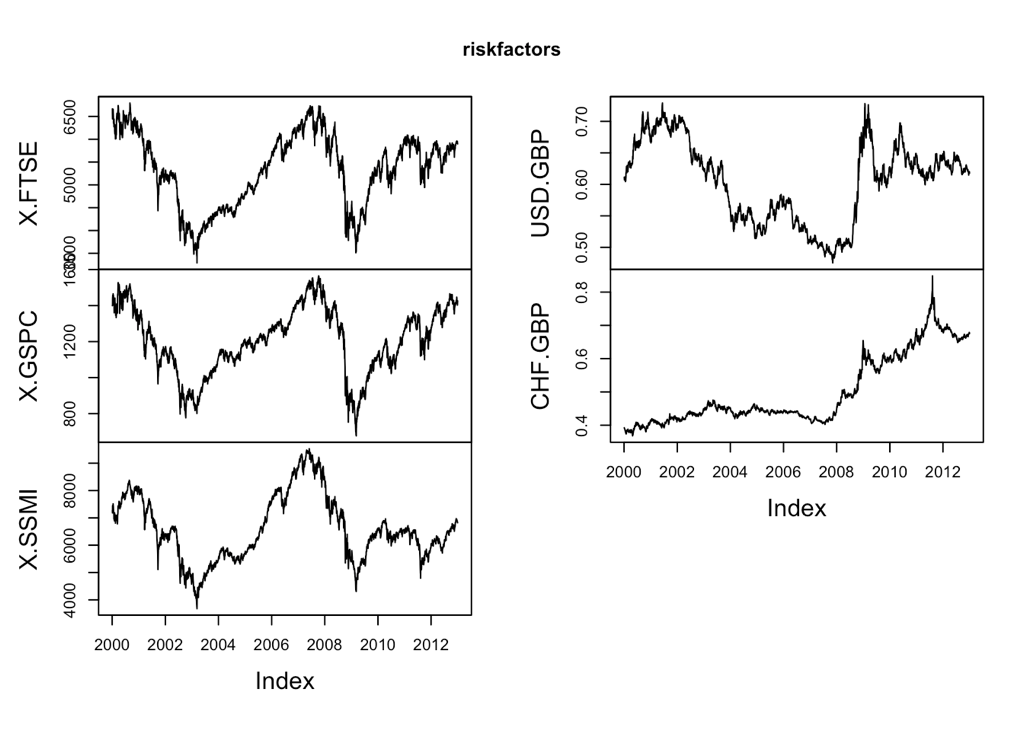
riskfactors <- merge(FTSE, SP500, SMI, USD_GBP, CHF_GBP, all = FALSE)["/2012-12-31", ]
Quantitative Risk Management in R

Displaying the risk factors

plot.zoo(riskfactors)

Quantitative Risk Management in R

Historical simulation

  • Simple method that is widely used in financial industry
  • Resample historical risk-factor returns and examine their effect on current portfolio
  • Loss operator shows effect of different risk-factor returns on the portfolio
  • Loss operator functions will be provided in the exercises
Quantitative Risk Management in R

Empirical estimates of VaR and ES

losses <- rnorm(100)
losses_o <- sort(losses, decreasing = TRUE)
head(losses_o, n = 8)
1.836163 1.775163 1.745427 1.614479 1.602120 1.590034 1.483691 1.408354
quantile(losses, 0.95)
     95% 
1.590638
qnorm(0.95)
1.644854
Quantitative Risk Management in R

Empirical estimates of VaR and ES

mean(losses[losses > quantile(losses, 0.95)])
1.714671
ESnorm(0.95)
2.062713
Quantitative Risk Management in R

Let's practice!

Quantitative Risk Management in R

Preparing Video For Download...