Testing for normality

Quantitative Risk Management in R

Alexander McNeil

Professor, University of York

How to test for normality

  • Use the quantile-quantile plot (Q-Q plot)
  • Sample of quantiles of data versus theoretical quantiles of a normal distribution
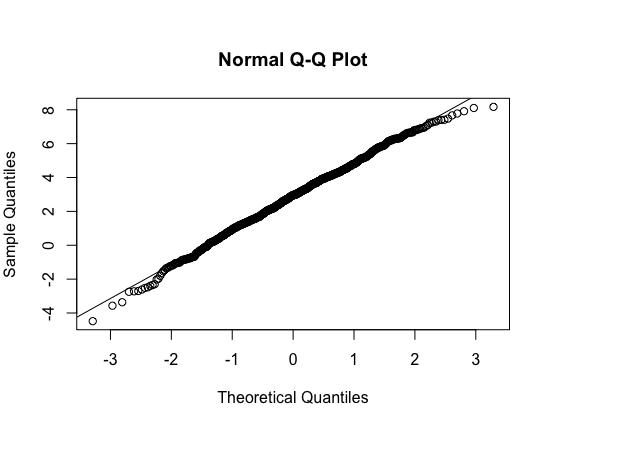
data <- rnorm(1000,
        mean = 3,
        sd = 2)

qqnorm(data)
qqline(data)

normal QQ plot

Quantitative Risk Management in R

Interpreting the Q-Q plot

  • Data with heavier tails than normal: inverted S shape
  • Data with lighter tails than normal: S shape
  • Data from a very skewed distribution: curved shape
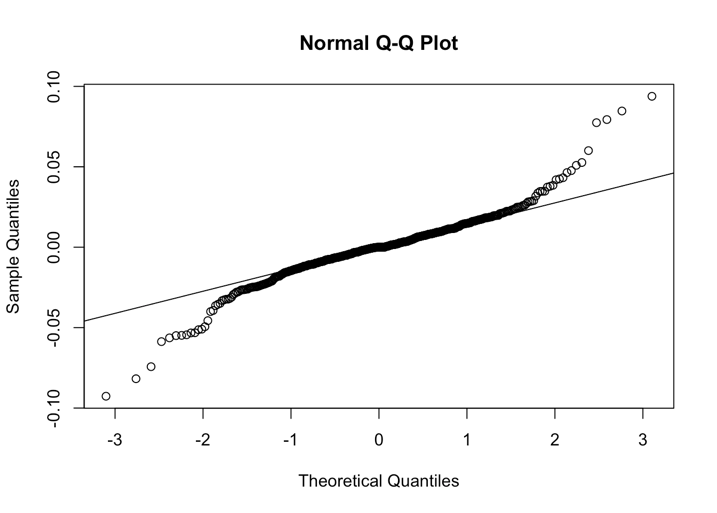
qqnorm(ftse)
qqline(ftse)

Quantitative Risk Management in R

Let's practice!

Quantitative Risk Management in R

Preparing Video For Download...