The normal distribution

Quantitative Risk Management in R

Alexander McNeil

Professor, University of York

Definition of normal

  • If risk factors follow GBM, then log-returns should be independent normal
  • Is this the case?
  • A variable x is normal if it has density:

$$f_X(x) = {{1} \over {\sigma \sqrt{2\pi}}} e^{-{{(x-\mu)^2} \over {\sigma ^ 2}}} $$

  • Depends on two parameters: $\mu$ and $\sigma$
Quantitative Risk Management in R

Properties of the normal

  • $\mu$ is the mean and $\sigma ^ 2$ is the variance
  • Usual notation: $X \sim N(\mu,\sigma ^2)$
  • Parameters easily estimated from data
  • Sum of 2+ independent normal variables is also normal
Quantitative Risk Management in R

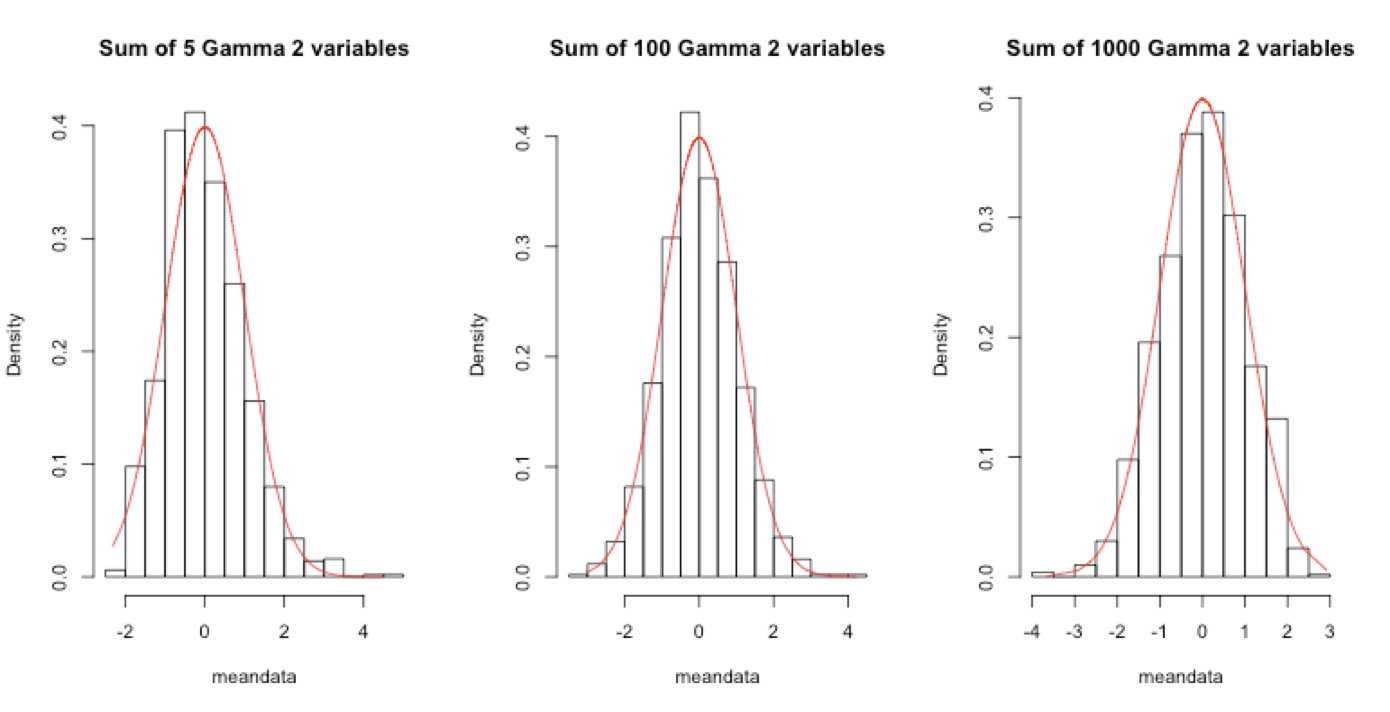
Central limit theorem (CLT)

Quantitative Risk Management in R

How to estimate a normal distribution

  • Data: $X_1,...,X_n$
  • Method of moments:

$$\hat{\mu} = {1 \over n} {\sum_{t=1}^n}X_t $$

$$\hat{\sigma}^2_u = {1 \over {n - 1}} {\sum_{t=1}^n}(X_t - \hat{\mu})^2 $$

  • Application to FTSE log-returns from 2008-09
Quantitative Risk Management in R

FTSE example

head(ftse)
-0.09264548 -0.08178433 -0.07428657 -0.05870079 -0.05637430 -0.05496918
tail(ftse)
0.05266208 0.06006960 0.07742977 0.07936751 0.08469137 0.09384244
mu <- mean(ftse)
sigma <- sd(ftse)
c(mu, sigma)
-0.0003378627  0.0194090385
Quantitative Risk Management in R

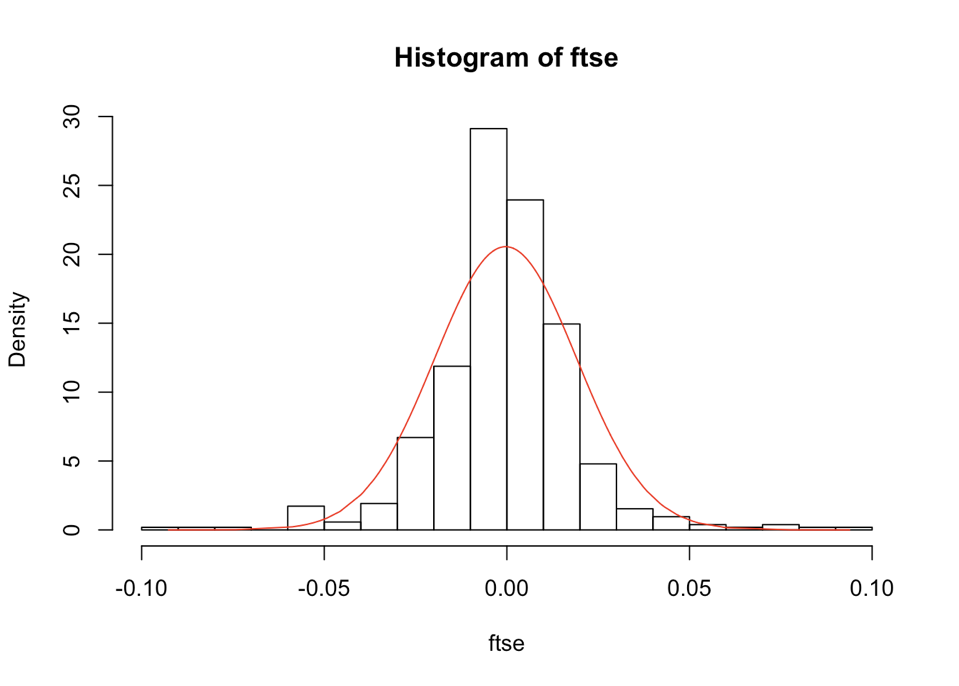
Displaying the fitted normal

hist(ftse, nclass = 20, probability = TRUE)

lines(ftse, dnorm(ftse, mean = mu, sd = sigma), col = "red")

Quantitative Risk Management in R

Let's practice!

Quantitative Risk Management in R

Preparing Video For Download...