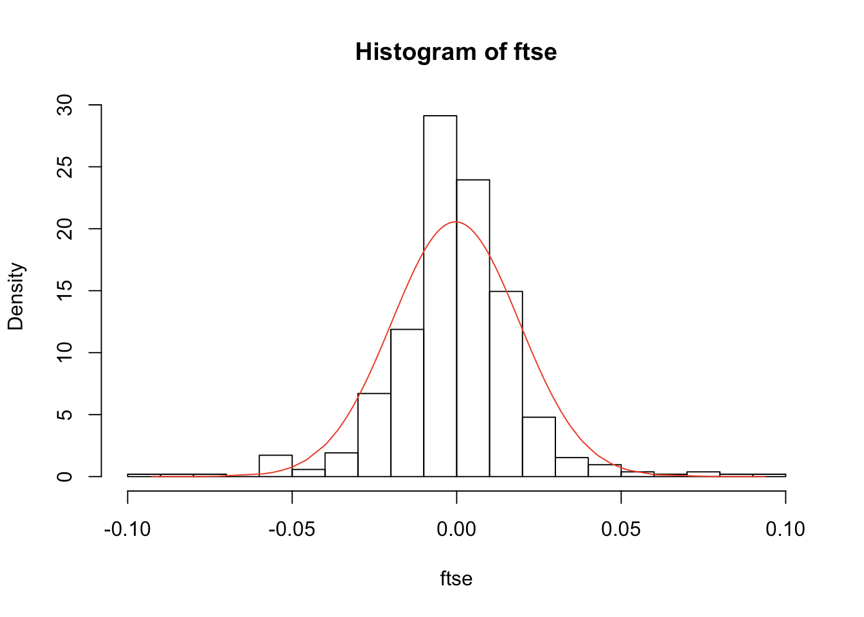
Skewness, kurtosis and the Jarque-Bera test

Quantitative Risk Management in R

Alexander McNeil

Professor, University of York

Skewness and kurtosis

  • Skewness (b) is a measure of asymmetry
  • Kurtosis (k) is a measure of heavy-tailedness
  • Skewness and kurtosis of normal are 0 and 3, respectively

$$ = {1 \over n}\sum_{t=1}^n(X_t-\hat{\mu})^3 \over \hat{\sigma}^3 $$

$$ = {1 \over n}\sum_{t=1}^n(X_t-\hat{\mu})^4 \over \hat{\sigma}^4 $$

Quantitative Risk Management in R

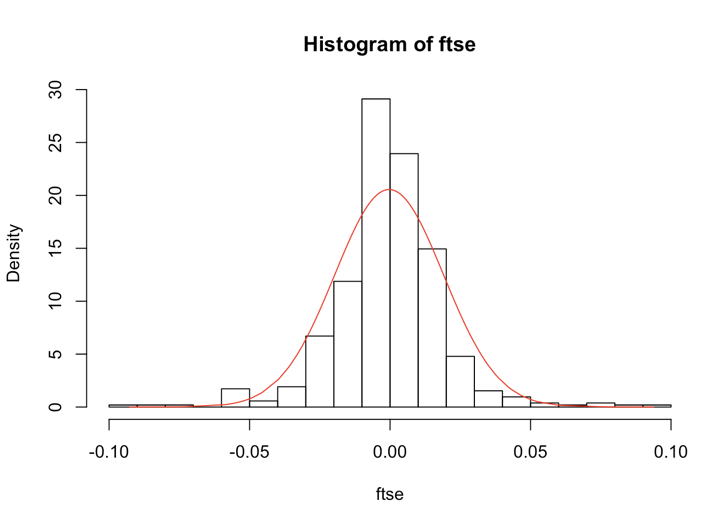
Skewness and kurtosis (II)

library(moments)

skewness(ftse)
-0.01187921
kurtosis(ftse)
7.437121

Quantitative Risk Management in R

The Jarque-Bera test

  • Compares skewness and kurtosis of data with theoretical normal values (0 and 3)
  • Detects skewness, heavy tails, or both

$$ T = {1 \over 6}n\left(b^2 + \frac{1}{4}(k - 3)^2\right) $$

jarque.test(ftse)
    Jarque-Bera Normality Test
data: ftse
JB = 428.23, p-value < 2.2e-16
alternative hypothesis: greater
Quantitative Risk Management in R

Longer-interval and overlapping returns

  • Daily returns are usually very non-normal
  • What about longer-intervals returns?
  • Weekly, monthly, quarterly returns obtained by summation
  • Recall CLT - suggests they may be more normal
  • Reduce quantity of data so tests are weaker
  • Can also analyze overlapping or moving sums of returns
Quantitative Risk Management in R

Let's practice!

Quantitative Risk Management in R

Preparing Video For Download...