The Student t distribution
Quantitative Risk Management in R

Alexander McNeil
Professor, University of York
The Student t distribution
$$f_X(x) = \frac{\Gamma({\frac{\nu+1}{2}})}{\sigma \sqrt{\nu\pi} \, \Gamma(\frac{\nu}{2})}{\left(1 + \frac{({x- \mu})^2} {\nu \sigma ^ 2}\right)}^{-\frac{\nu + 1}{2}} $$
- This distribution has three parameters: $\mu, \sigma, \nu$
- Small values of $\nu$ give heavier tails
- As $\nu$ gets larger the distribution tends to normal
Fitting the Student t distribution
- Method of maximum likelihood (ML)
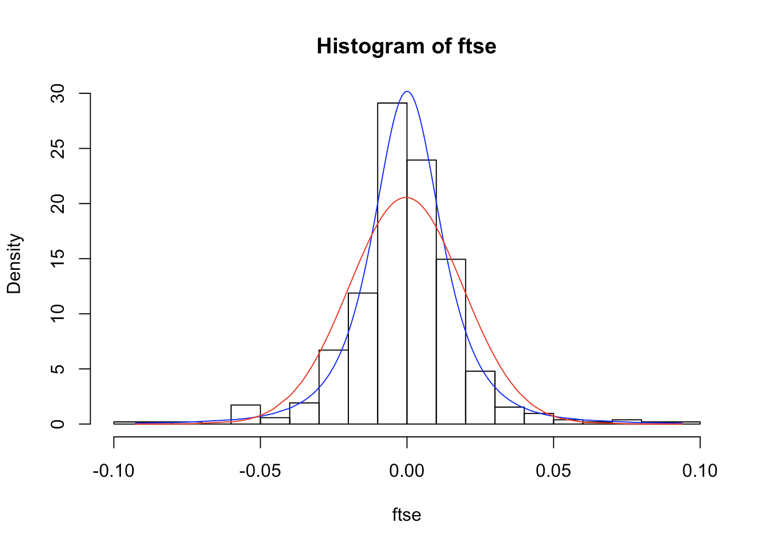
fit.st()in QRM package- Small $\nu$ value (2.95) for FTSE log-returns from 2008-09
library(QRM)

tfit <- fit.st(ftse)
tpars <- tfit$par.ests
tpars
          nu             mu          sigma
2.949514e+00   4.429863e-05   1.216422e-02
nu <- tpars[1]
mu <- tpars[2]
sigma <- tpars[3]
Displaying the fitted Student t distribution
hist(ftse, nclass = 20, probability = TRUE)
lines(ftse, dnrom(ftse, mean = mean(ftse), sd = sd(ftse)), col = "red")

yvals <- dt((ftse - mu)/sigma, df = nu)/sigma
lines(ftse, yvals, col = "blue")

Let's practice!
Quantitative Risk Management in R

