Computing financial ratios using pandas
Analyzing Financial Statements in Python

Rohan Chatterjee
Risk Modeler
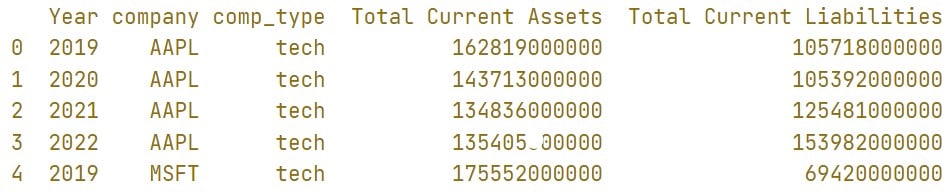
Structure of balance sheet data
- Balance sheet data loaded in
pandasDataFrame calledbalance_sheet.
print(balance_sheet.head())
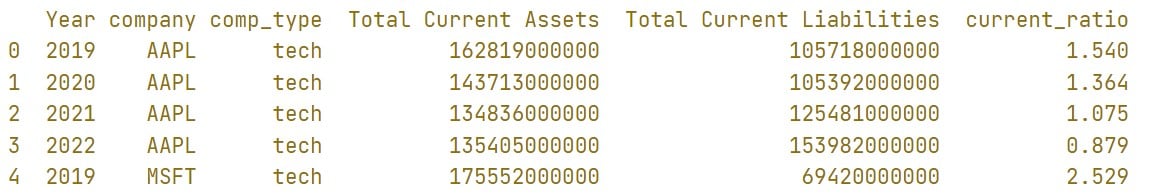
Computing current ratio
balance_sheet["current_ratio"] = balance_sheet["Total Current Assets"] /
                                 balance_sheet["Total Current Liabilities"]
print(balance_sheet.head())
Using .groupby() to get results by group
- To get the average current ratio by industry:
balance_sheet.groupby("comp_type")["current_ratio"].mean()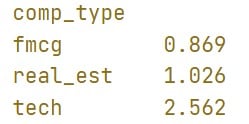
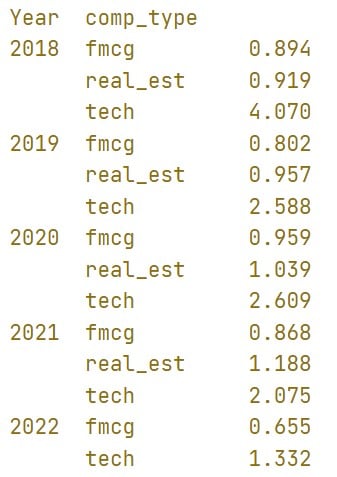
Using .groupby() to get results by group
balance_sheet.groupby(["Year","comp_type"])["current_ratio"].mean()
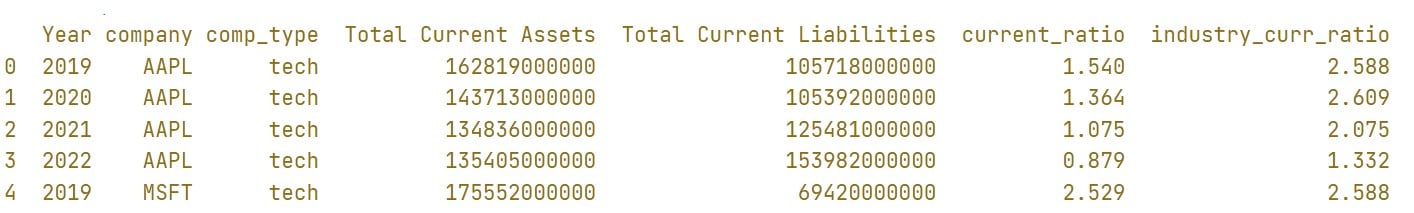
Using groupby().transform()
.transform()can be used after.groupby()to append the groupby result to rows according to the group each row belongs to.balance_sheet["industry_curr_ratio"] = balance_sheet.groupby([ "Year","comp_type"])["current_ratio"].transform("mean") print(balance_sheet.head())
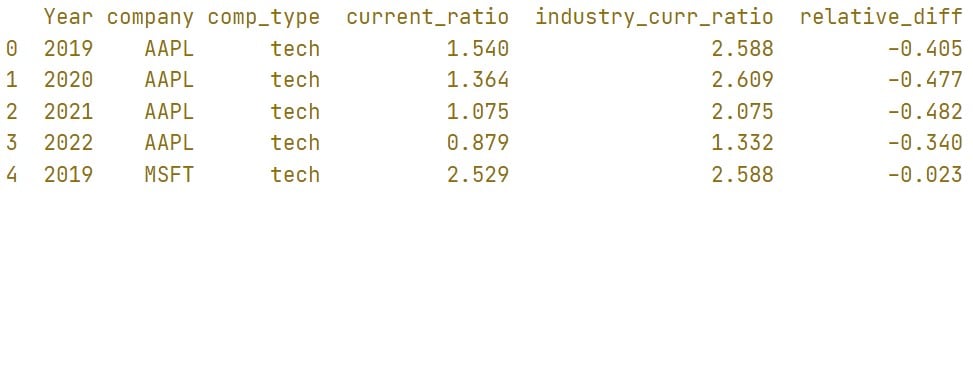
Using .groupby().transform()
balance_sheet["relative_diff"] =
                            (balance_sheet["current_ratio"] /
                             balance_sheet["industry_curr_ratio"]) - 1