More on analyzing profitability
Analyzing Financial Statements in Python

Rohan Chatterjee
Risk Modeler
Checking correlations between different ratios
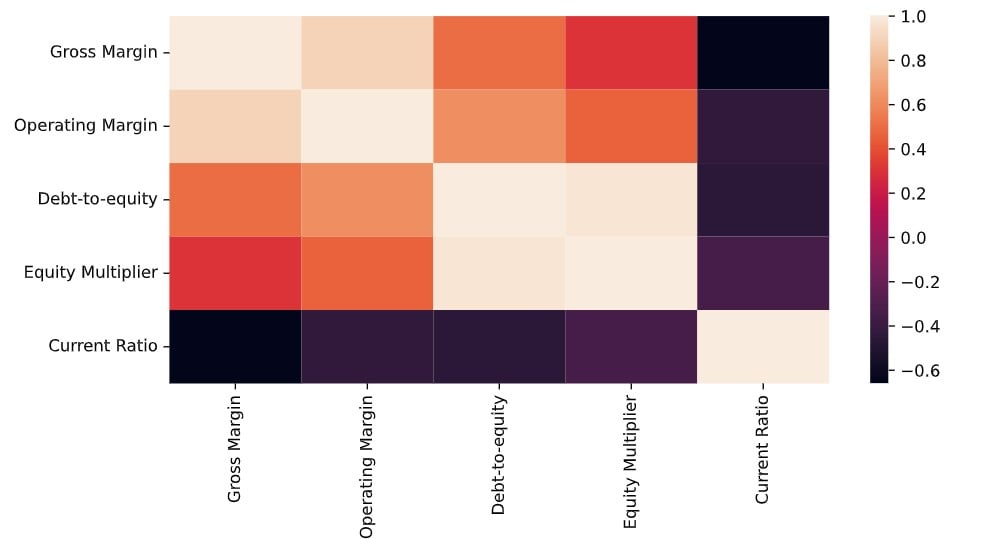
How to make a heat map
- Making a heat map require a matrix
real_est_corr = real_estate[["Gross Margin",
                           "Operating Margin", "Debt-to-equity",
                           "Equity Multiplier", "Current Ratio"]
                         ].corr()
real_est_corr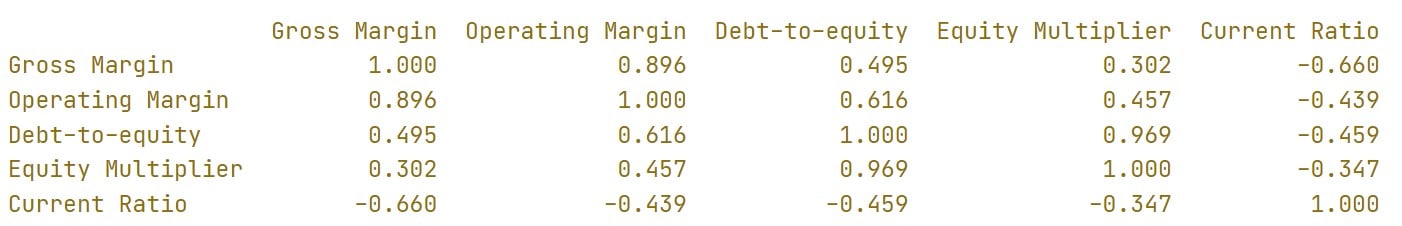
How to make a correlation plot
sns.heatmap(real_est_corr)
plt.show()
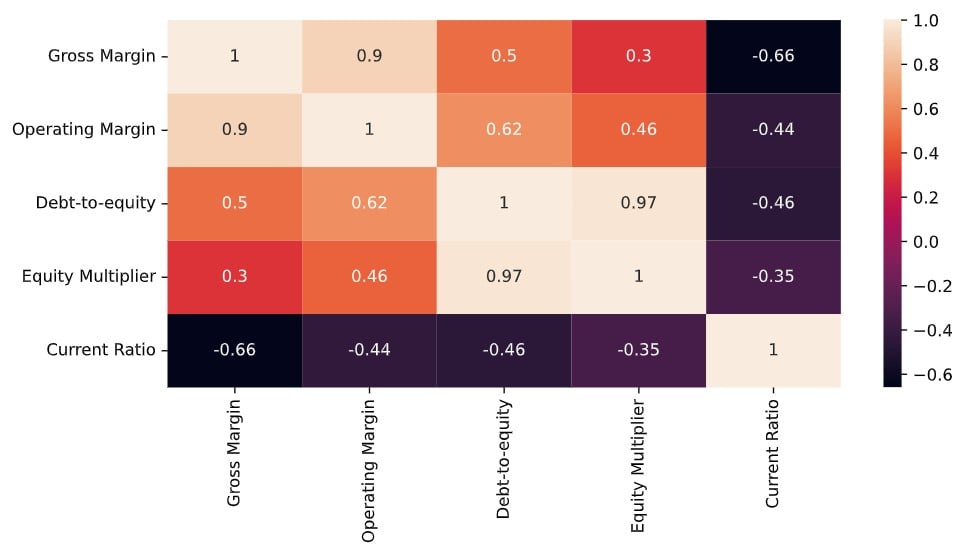
How to make a correlation plot
sns.heatmap(real_est_corr, annot=True)
plt.show()
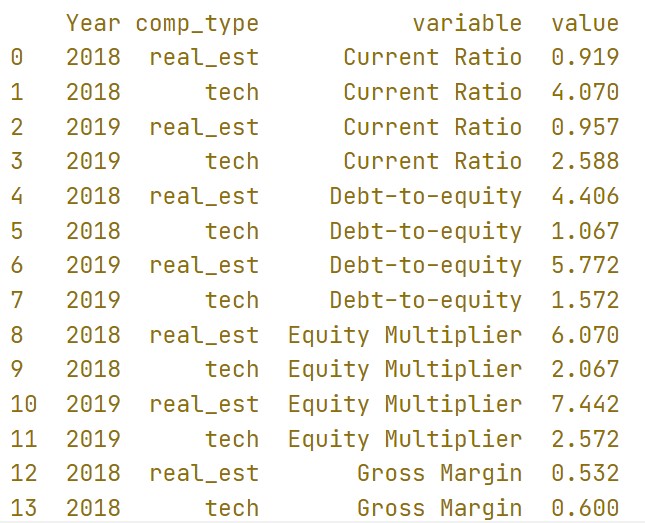
Multifaceted bar chart
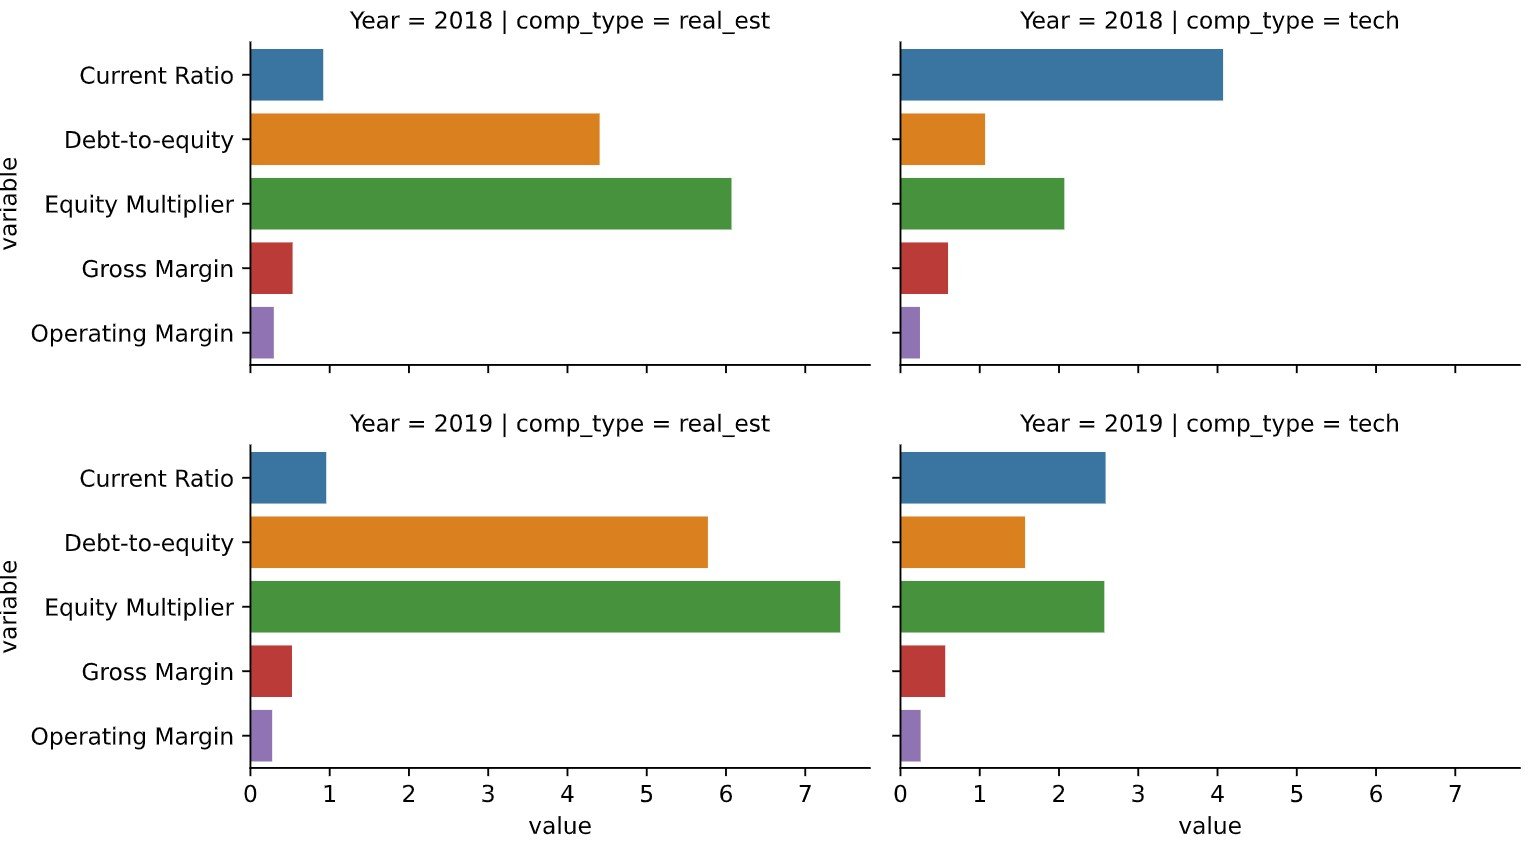
How to make a multifaceted bar chart?
How to make a multifaceted bar chart?
sns.catplot(data=dataset, x="value", y="variable", row="Year", col = "comp_type",
            kind="bar")
plt.subplots_adjust(hspace=0.25)
plt.show()

