Financial ratios from the cash flow statement

Analyzing Financial Statements in Python

Rohan Chatterjee

Risk Modeler

Reading in JSON data

  • Data from the wild does not always come in spreadsheets
  • Sometimes it comes in the JSON ("JavaScript Object Notation") format
  • Companies can share their financial statement information in JSON
  • We can read JSON files into Python using pandas
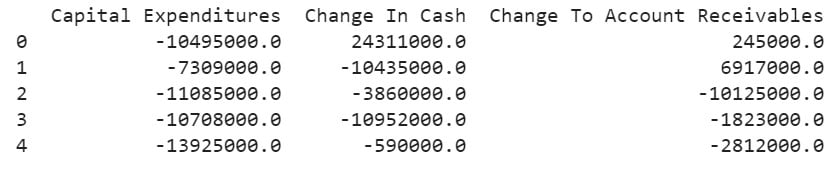
cash_flow = pd.read_json("cash_flow_statement.json")
print(cash_flow.head())

This image shows the top 5 rows of the cash flow statement data which was loaded.

Analyzing Financial Statements in Python

Cash flow to net income ratio

  • Proportion of cash flow from operating activities to net income

  • Operating activities are core activities of the business

  • High ratio implies business generates sizable proportion of cash from operating activities

Formula:

$$\dfrac{\text{Cash flow from operating activities}}{\text{Net income}}$$

Analyzing Financial Statements in Python

Operating cash flow ratio

  • Proportion of cash flow from operating activities to current liabilities
  • Measure of how many times company can pay off short-term obligations from cash generated from core business
  • Ratio of more than one implies that a business generates more than enough cash to meet its short-term obligations

Formula:

$$\dfrac{\text{Cash flow from operating activities}}{\text{Current liabilities}}$$

Analyzing Financial Statements in Python

Imputing missing values

  • Data in "the wild" often has missing values
  • Data from the numerator of a ratio might be available, but its denominator might be missing, or vice-versa
  • Solution: impute missing data with data from other companies
Analyzing Financial Statements in Python

Imputing missing values

  • In the DataFrame named dataset shown, some entries of "Total Current Liabilities" are missing, indicated by NaN

This image shows the top rows of a cash flow statement where some of the entries in the column total liabilities has missing values.

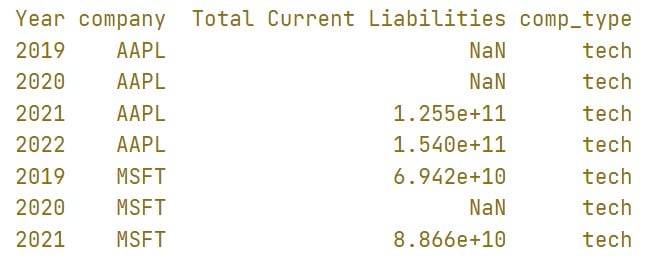
  • Missing current liabilities for a company can be imputed using non-missing values for that company
Analyzing Financial Statements in Python

Imputing missing values

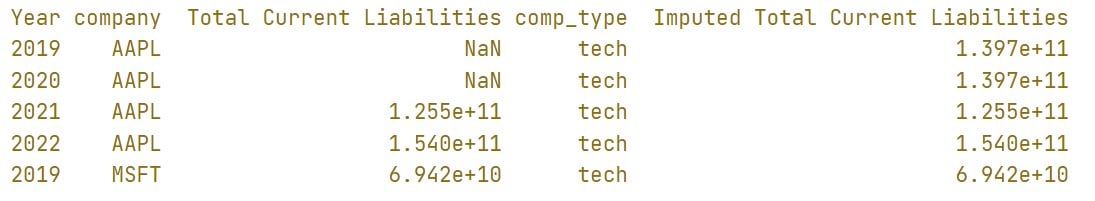
  • We fill in missing values with the average of non-missing values of the companies:
imputation = dataset.groupby("company")["Total Current Liabilities"].transform("mean")

dataset["Imputed Total Current Liabilities"] = dataset["Total Current Liabilities"].fillna(imputation)
  • After imputing, dataset looks like:

This image shows the top rows of a cash flow statement where some of the entries in the column total liabilities has missing values. It has another column called imputed total current liabilities where the missing values are imputed.

  • Take percentiles to be conservative
Analyzing Financial Statements in Python

Imputing missing values with percentiles

  • Imputing a missing value with its 70th percentile worse non-missing value will give a more conservative imputation for it.

  • Computing ratios with the more conservative imputation might be more prudent if the ratio is to be used in decision-making.

  • Imputing missing values using 70th percentile, grouped over company:
imputation = dataset.groupby("company")["Total Current Liabilities"]\
    .transform(lambda x: np.nanquantile(x, 0.7))

dataset["Imputed Total Current Liabilities"] = dataset["Total Current Liabilities"]\
    .fillna(imputation)
Analyzing Financial Statements in Python

Let's practice!

Analyzing Financial Statements in Python

Preparing Video For Download...