Analysis for Inventory Control and Management
Case Study: Inventory Analysis in Tableau

Iason Prassides
Content Developer, DataCamp
Analysis workflow

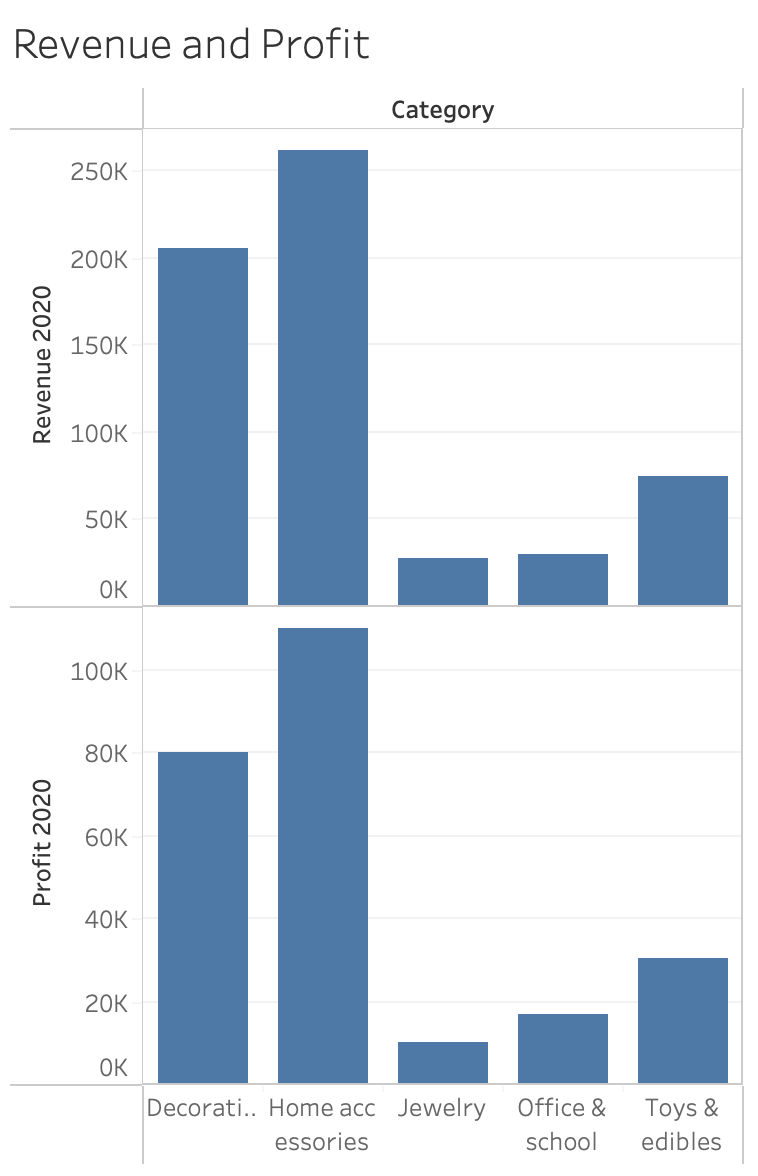
Preliminary results
Inventory analysis metrics

ABC analysis
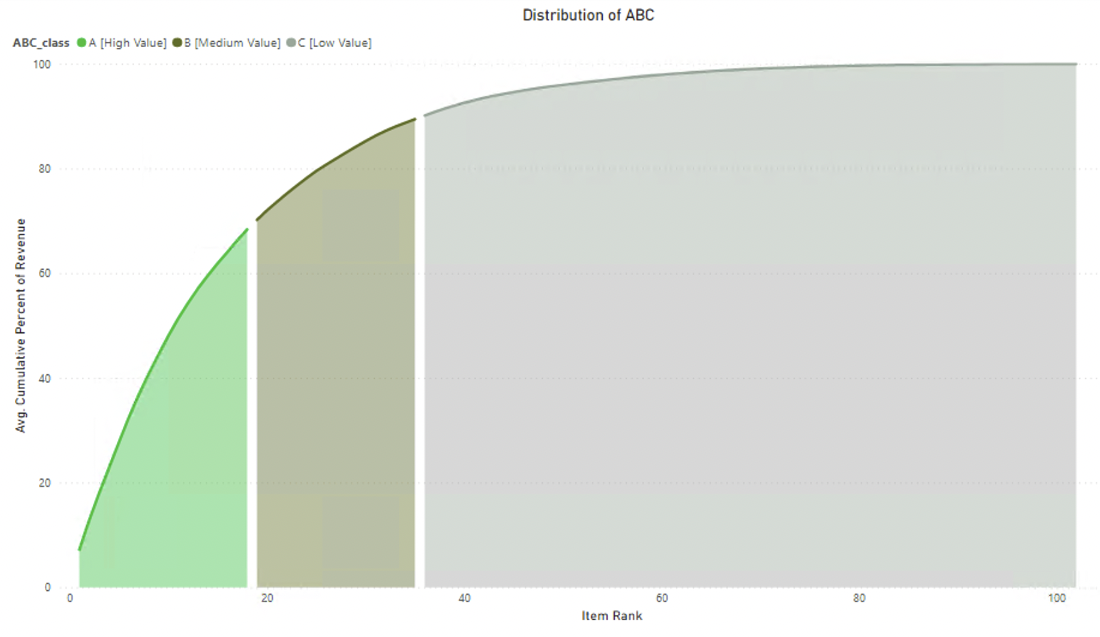
1 Handanhal and Misra (2014). ABC Analysis for Inventory Management: Bridging the Gap between Research and Classroom.

