Inventory Analysis with Tableau
Case Study: Inventory Analysis in Tableau

Iason Prassides
Content Developer, DataCamp
What is a case study?

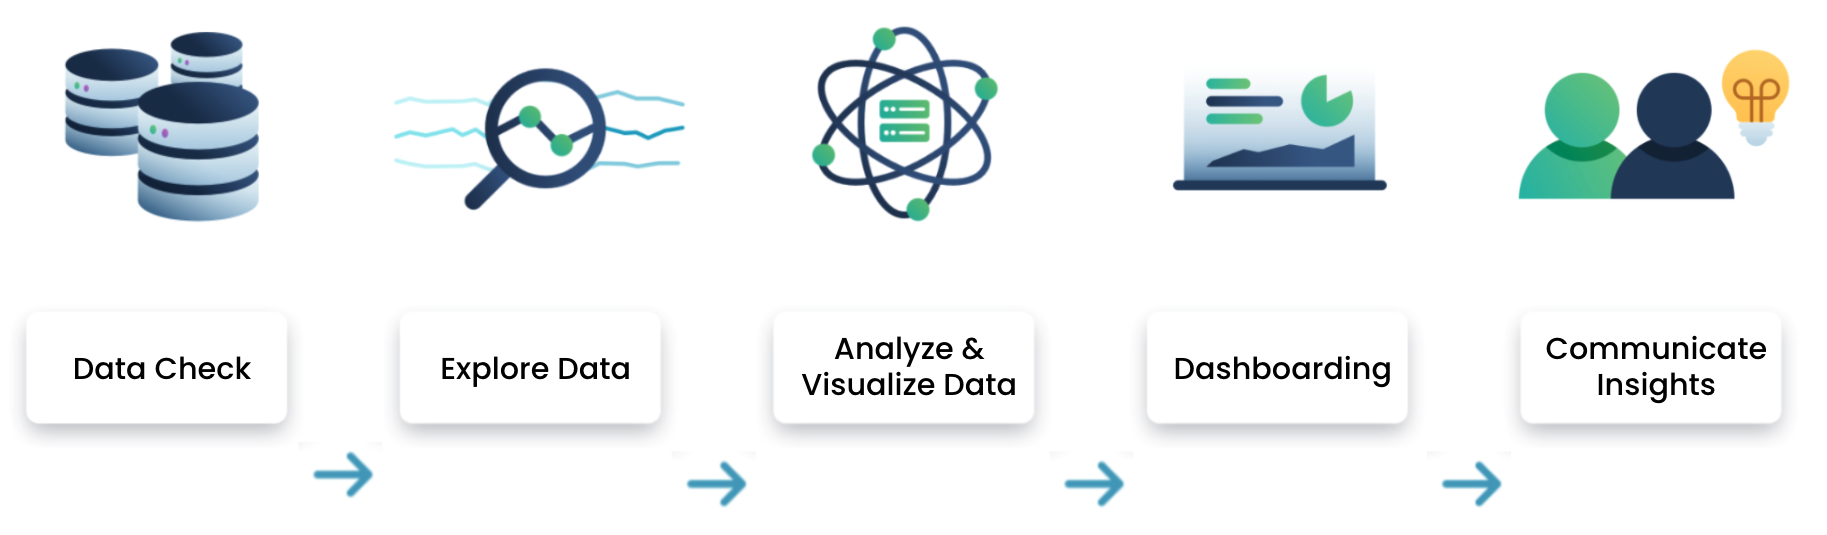
Steps of the analysis
The problem

What is inventory analysis?
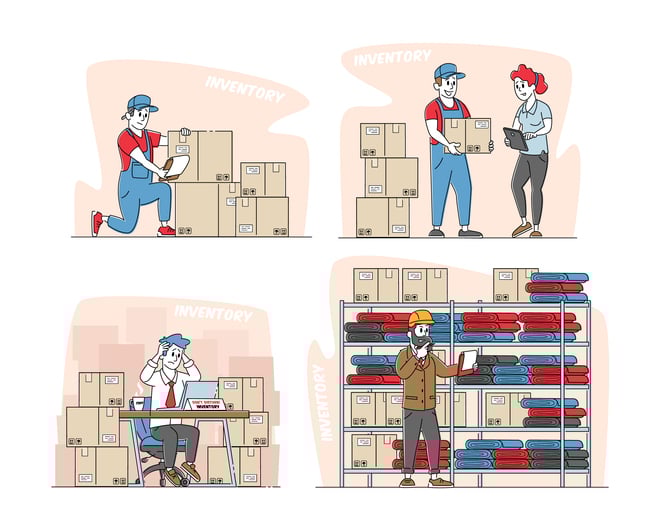
Starting with inventory analysis

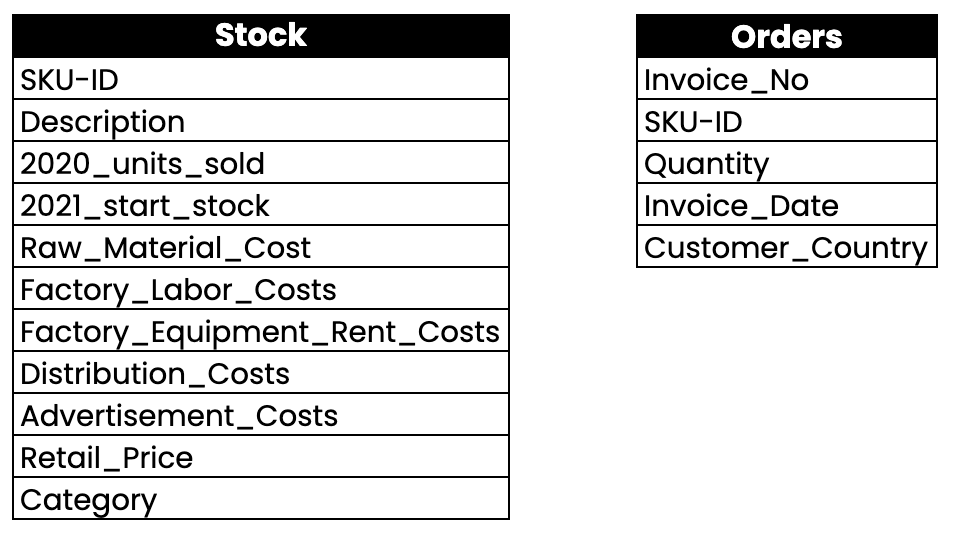
Dataset
Case Study: Inventory Analysis in Tableau
Iason Prassides
Content Developer, DataCamp

