Efficient workflow
Data Manipulation in Julia

Katerina Zahradova
Instructor
Get to know the data
- Take the time to understand the data
- Easier to extract information later
- Make plots, print the results, ...

1 Photo by Myriam Jessier on Unsplash
Ask for help!
- Don't reinvent the wheel, use resources available
- Stack Overflow
- DataCamp Cheat Sheets
- ...

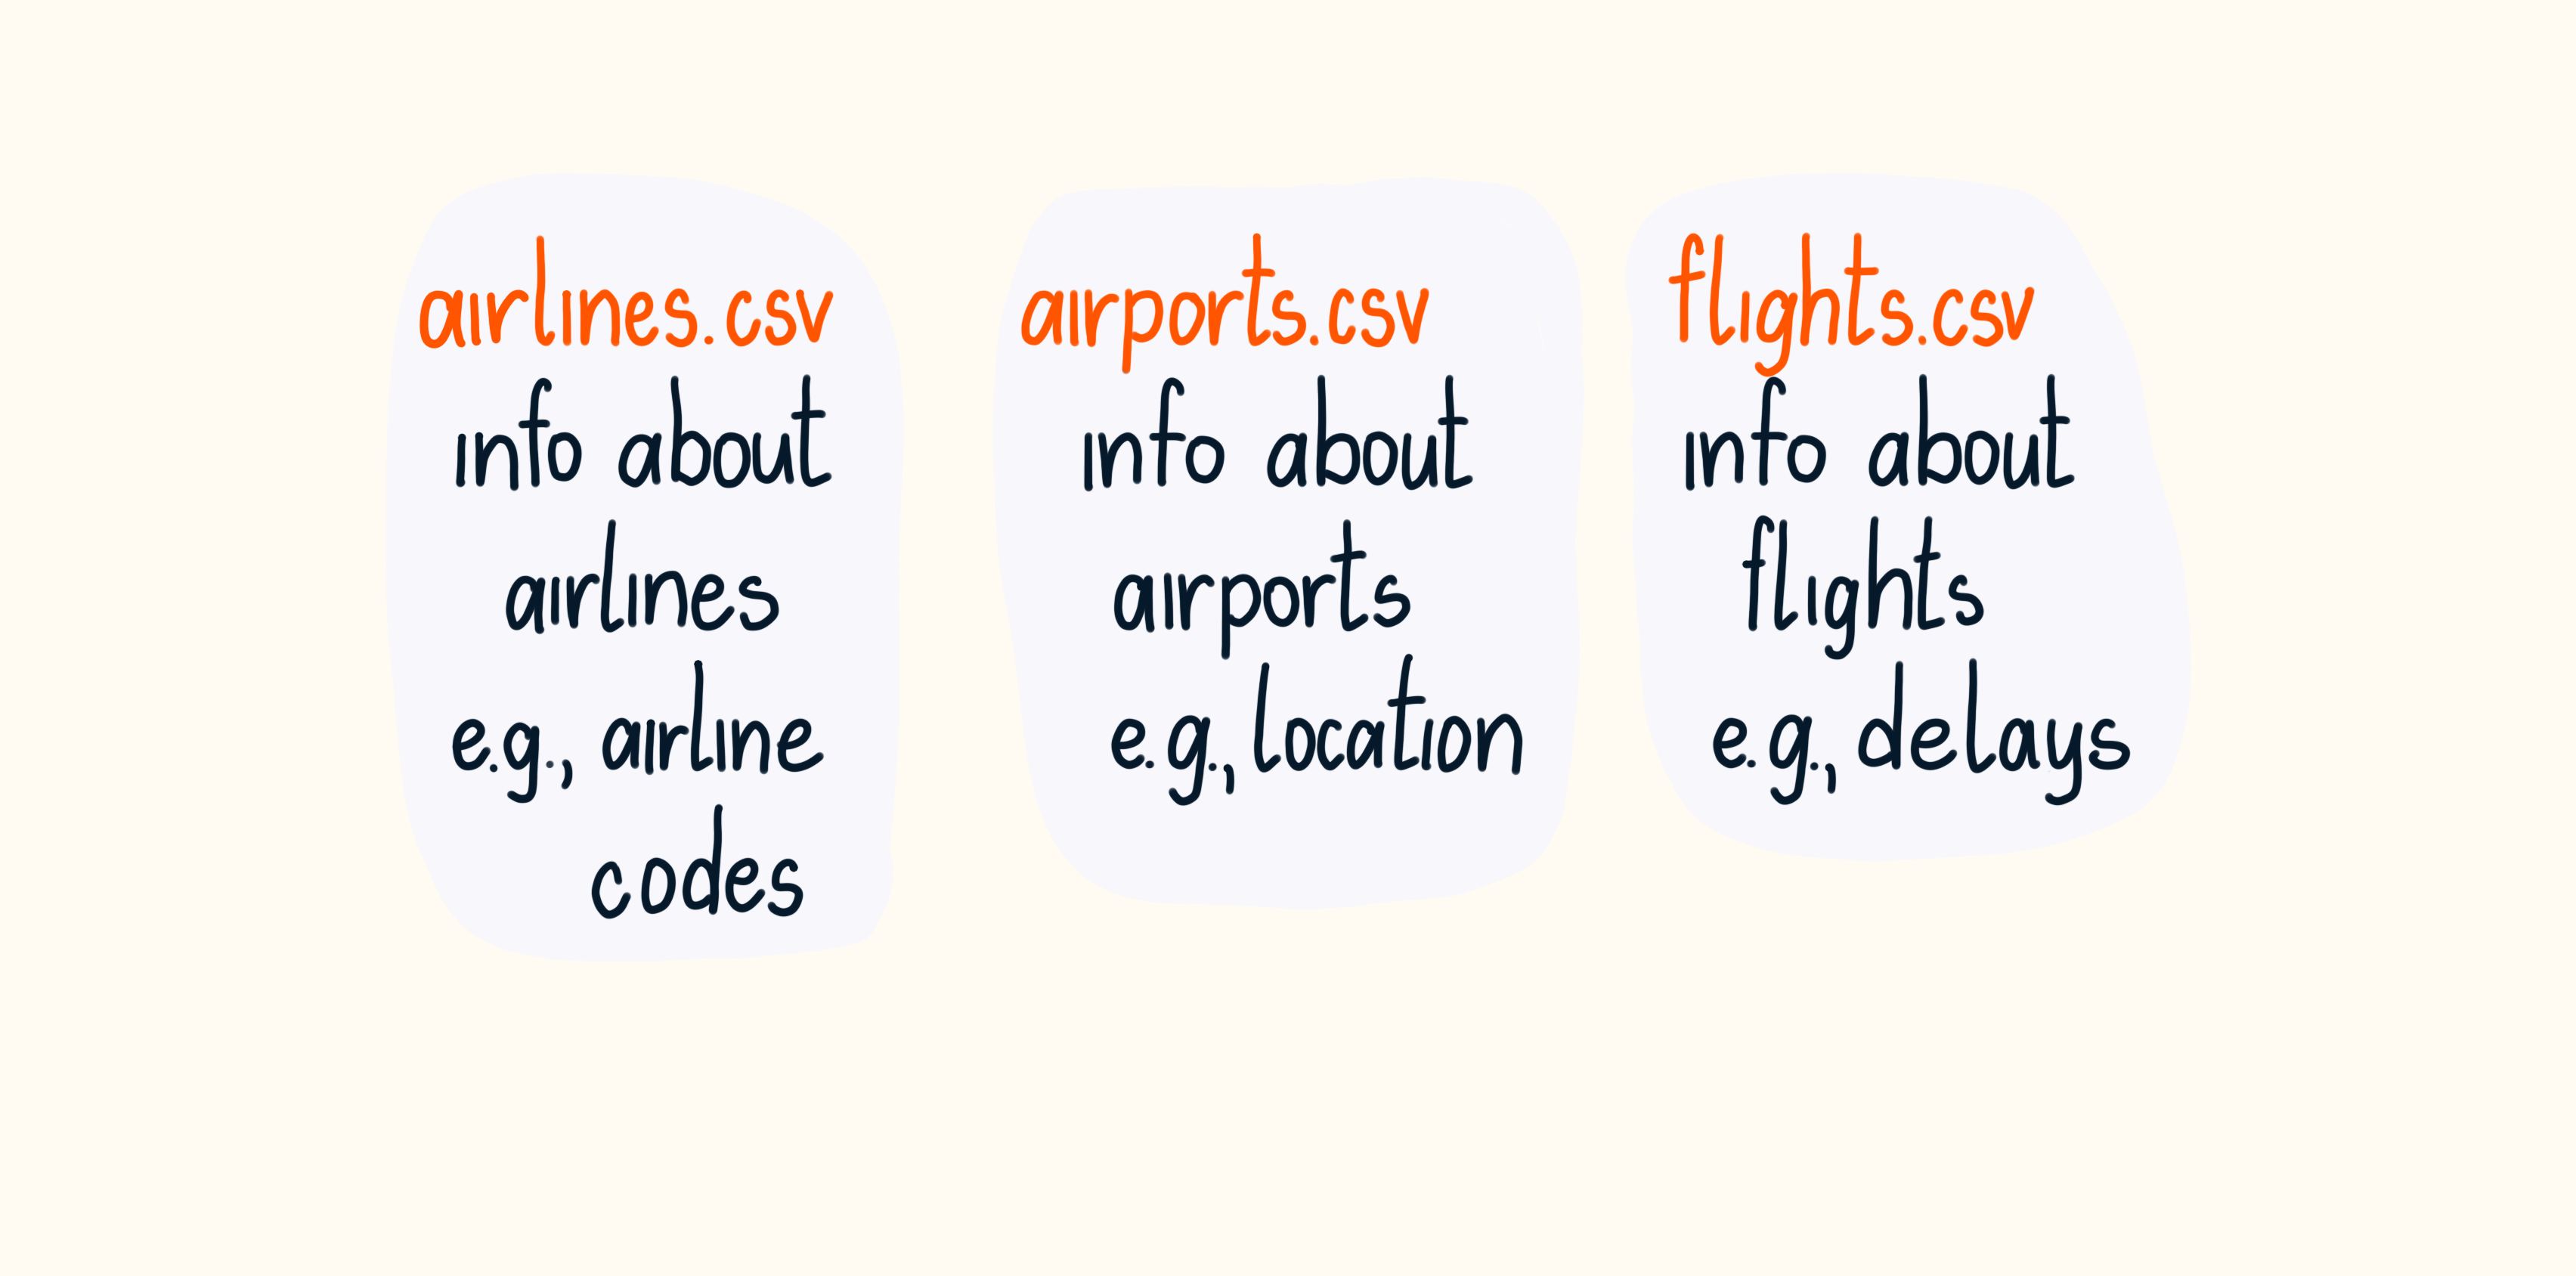
Flight delays in US airports