Your first shinydashboard
Building Dashboards with shinydashboard

Png Kee Seng
Researcher
The road so far
- Wireframing in the user interface (UI)
- Header, side bar, body
- Define outputs and their interactions with user inputs
- The server will play this role

header <- dashboardHeader(...) sidebar <- dashboardSidebar(...) body <- dashboardBody(...)ui <- dashboardPage(header, sidebar, body)server <- function(input, output) { ... }shinyApp(ui, server)
The server
- Need to define outputs and inputs
- Specify outputs, and how they interact with user inputs
- Useful to define our own helper functions to reduce clutter and improve readability
- Place these helper functions at the top of our code

Adding a plot
- Back to the global soccer tournament dashboard
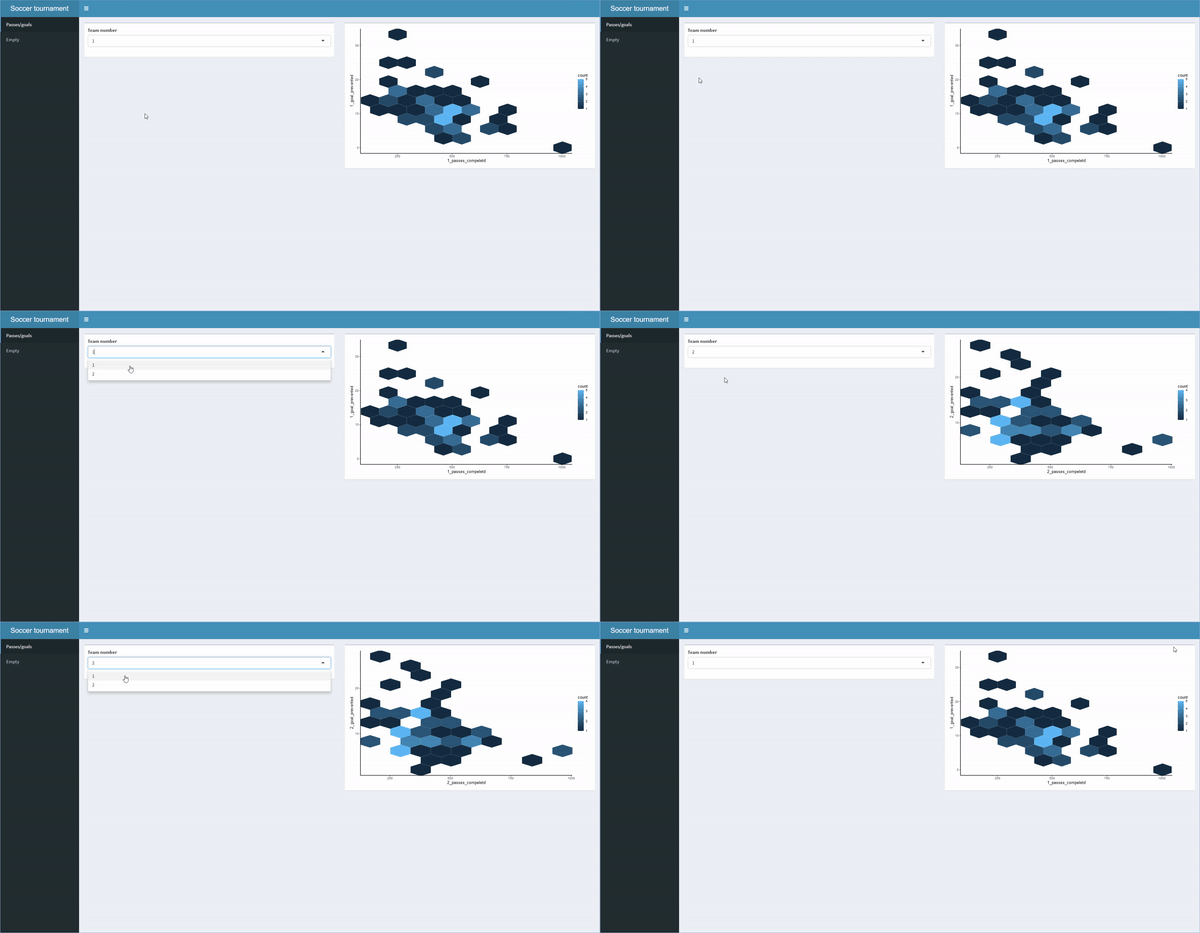
- Let's add a hexbin plot for team 1
- We will then need to place this plot in the server
- What if we want the same plot for team 2?
soccer %>%
  ggplot(aes(x=`1_passes_compeletd`,
             y=`1_goal_prevented`)) +
  geom_hex(bins=10) + theme_classic()
server <- function(input, output){
  output$plot1 <- renderPlot({
  fifa %>%
    ggplot(aes(x=`1_passes_compeletd`,
               y=`1_goal_prevented`)) +
    geom_hex(bins=10) + theme_classic()
  })
}
Defining ggplot objects within server
server <- function(input, output) { output$plot1 <- renderPlot({ if (input$team == 1){fifa %>% ggplot(aes(x=`1_passes_compeletd`, y=`1_goal_prevented`)) + geom_hex(bins=10) + theme_classic()} else if (input$team == 2){fifa %>% ggplot(aes(x=`2_passes_compeletd`, y=`2_goal_prevented`)) + geom_hex(bins=10) + theme_classic()} }) }
Using helper functions
plot_hex <- function(team){
  if (team == 1){
    soccer %>% ggplot(aes(x=`1_passes_compeletd`,
                        y=`1_goal_prevented`)) +
      geom_hex(bins=10) + theme_classic()
  }
  else if (team == 2){
    soccer %>% ggplot(aes(x=`2_passes_compeletd`,
                        y=`2_goal_prevented`)) +
      geom_hex(bins=10) + theme_classic()
  }
}
Using helper functions
With helper function
server <- function(input, output) {
  output$plot1 <- renderPlot(plot_hex(input$team))
}
- Isn't this more readable?
Without helper function
server <- function(input, output) {
  output$plot1 <- renderPlot({
    if (input$team == 1){
      soccer %>% ggplot(aes(x=`1_passes_compeletd`,
              y=`1_goal_prevented`)) +
        geom_hex(bins=10) + theme_classic()
      }
    else if (input$team == 2){
      soccer %>% ggplot(aes(x=`2_passes_compeletd`,
              y=`2_goal_prevented`)) +
        geom_hex(bins=10) + theme_classic()
      }
    })
}
Putting it all together
# A complete shinydashboardheader <- dashboardHeader(title = "Soccer tournament")sidebar <- dashboardSidebar(sidebarMenu(menuItem("Passes/goals", tabName = "passtab"), menuItem("Empty", tabName = "emptytab")))body <- dashboardBody(tabItems( tabItem("passtab", fluidRow(box(selectInput("team", "Team number", choices = c(1,2))), box(plotOutput("plot1"))) ), tabItem("emptytab")) )ui <- dashboardPage(header, sidebar, body)server <- function(input, output) { output$plot1 <- renderPlot(plot_hex(input$team)) }shinyApp(ui, server)

Let's practice!
Building Dashboards with shinydashboard

