The body
Building Dashboards with shinydashboard

Png Kee Seng
Researcher
Wireframing

1 Brett Jordan, Flickr
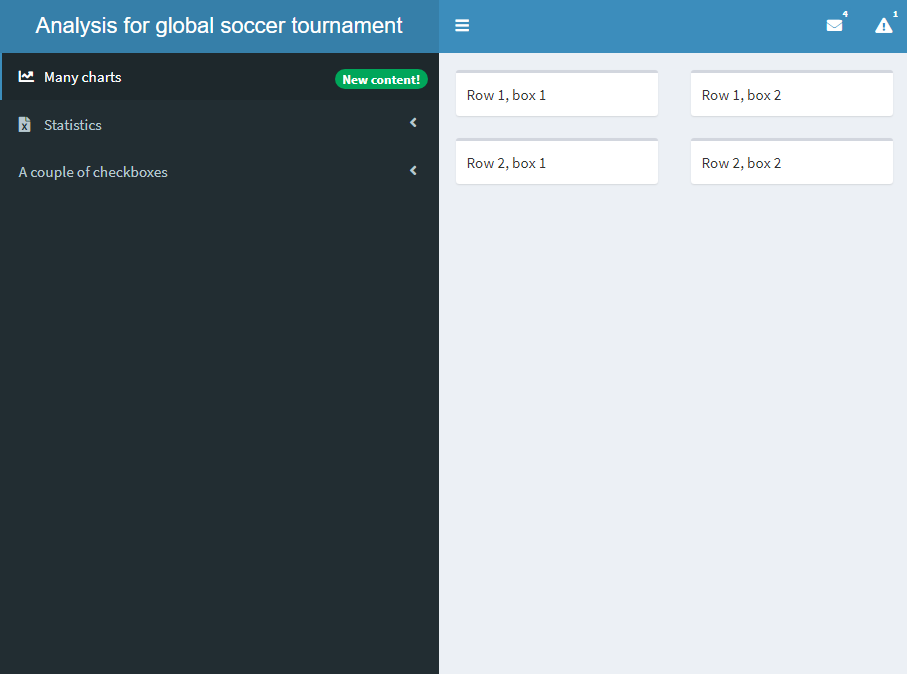
Adding rows and boxes: empty boxes
- Add rows with
fluidRow() - And add boxes with
box()
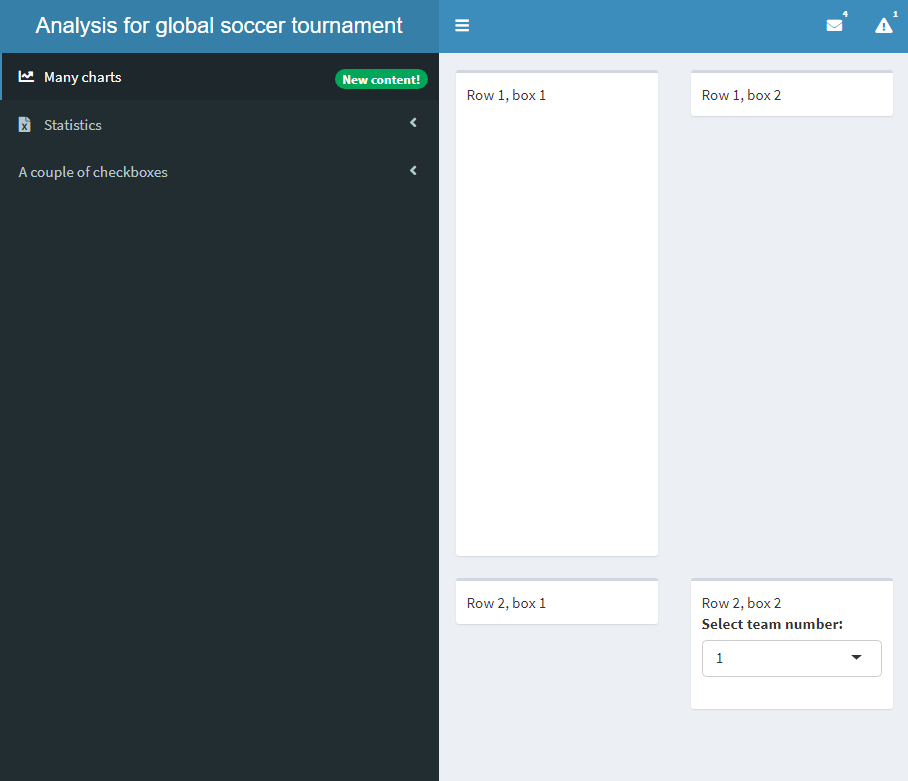
Adding rows and boxes: content in boxes
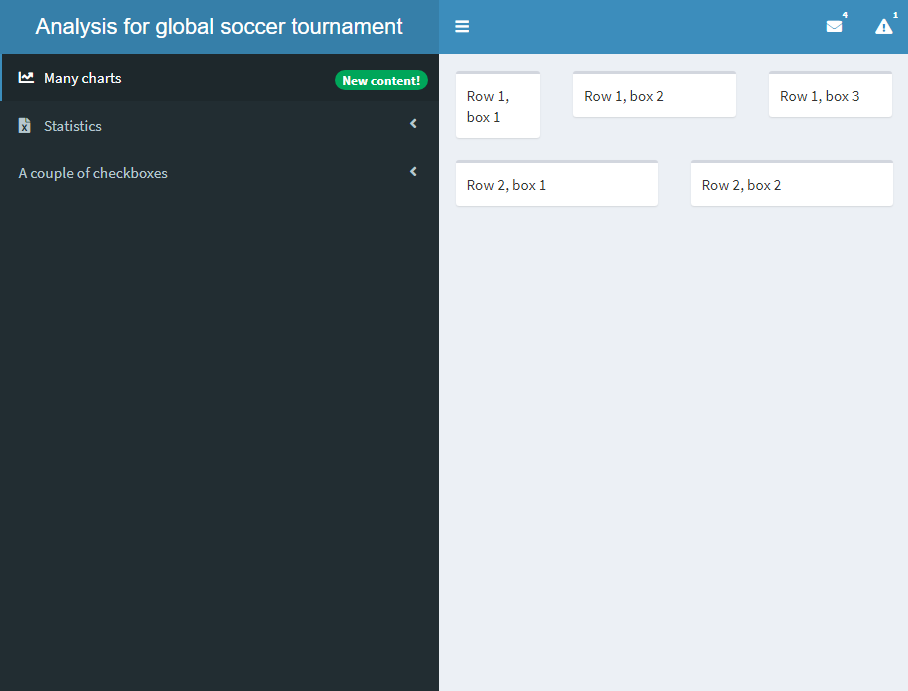
Prevent overflowing boxes
- Each box takes up 6 out of 12 units of the total horizontal space by default
- To prevent overflowing, set
width- In our example, set widths to 3, 5 and 4
- Adding
box()'s is highly recommended
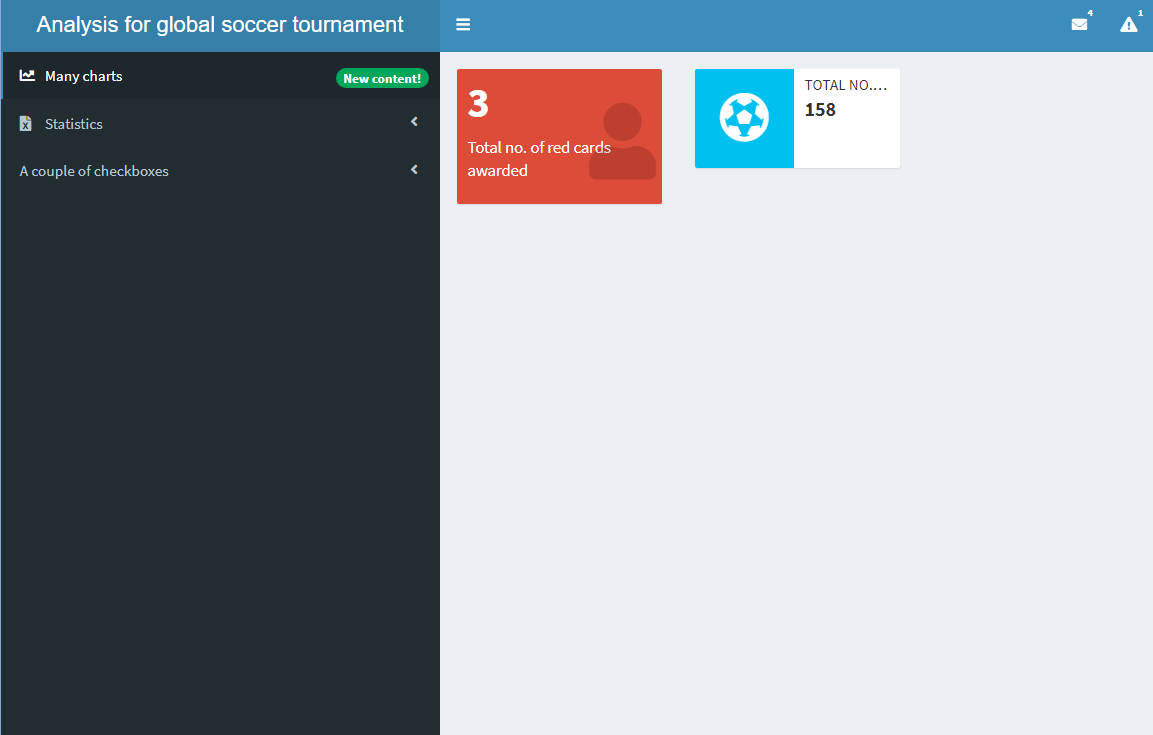
valueBox and infoBox
- There are also boxes that display small amounts of information
valueBox()infoBox()
valueBoxOutput and infoBoxOutput
- Variations of
valueBox()andinfoBox():valueBoxOutput()andinfoBoxOutput() - These are output functions
- There are also
renderValueBox()andrenderInfoBox() valueBox()andinfoBox()are needed
Linking the sidebar and body
- Recall earlier when we had a sidebar with two buttons called "charts" and "statistics"
- To link these to the body, we will need to add
tabItems()- Each page is defined by a
tabItem() - The labels on each
menuItem()-tabItem()pair must match
- Each page is defined by a

Tabs in the body
- In a shinyApp, a set of tabs can also be defined using
tabsetPanel()- Each tab is defined by
tabPanel()
- Each tab is defined by
- Do not confuse with
tabItems()andtabItem()