Types of input
Building Dashboards with shinydashboard

Png Kee Seng
Researcher
Input functions
- In the UI, users can provide inputs
- These are like instructions to the waiter
- In a shinyApp, instructions are communicated through the server
- This is done so by adding input functions to the UI
<type>input(<identifying label>, <displayed label>, ...)- The first argument is an identifying label
- The second argument is a displayed label
- The other arguments are specific to the type of input
An example: sleep study
- Imagine that we carried out a sleep study and collected data
- What could be some inputs that a shinyApp user can give?

1 Image by storyset on Freepik
selectInput
- A common input used is
selectInput() - This creates a drop-down menu with many possible options
- The third argument is a vector containing possible options
- In this example, we have four possible options.
- For now, let's keep the server empty
- Let's render the shinyApp by running
shinyApp()
ui <- fluidPage( titlePanel("Sleeping habits in America"), selectInput("selectlabel", "Select an option",choices = c("Option 1", "Option 2", "Option 3", "Option 4"))
server <- function(input, output, session) {
}
shinyApp(ui, server)
selectInput

selectInput with multiple selections
- We can also add another argument called
multipleui <- fluidPage( titlePanel("Sleeping habits in America"), selectInput("selectlabel", "Select an option", choices = c("Option 1", "Option 2", "Option 3", "Option 4"), multiple = TRUE)) server <- function(input, output, session) { } shinyApp(ui, server)
selectInput with multiple selections

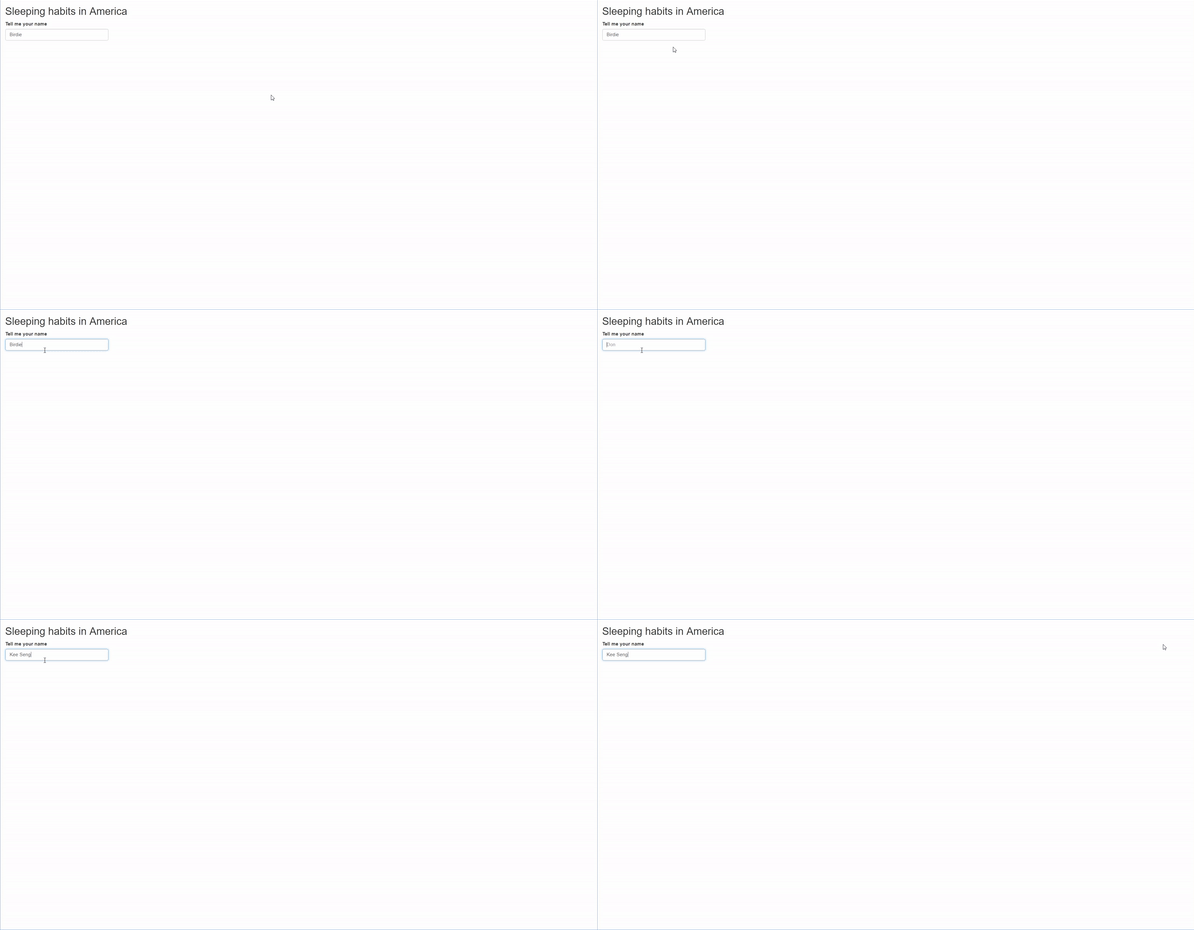
textInput
- There are two other important arguments
value: the value that the textbox is pre-filled withplaceholder: a preview of what the textbox should be filled with
ui <- fluidPage( titlePanel("Sleeping habits in America"), textInput("textlabel", "Tell me your name",value = "Birdie",placeholder = "Don"))
server <- function(input, output, session) {
}
shinyApp(ui, server)
textInput
checkboxInput
- This provides a single checkbox in the app
value: either TRUE or FALSE, to toggle the initial state of the checkbox- There is also a variation of
checkboxInput, calledcheckboxGroupInput
ui <- fluidPage( titlePanel("Sleeping habits in America"), checkboxInput("checkboxlabel", "65 years and over",value = FALSE))server <- function(input, output, session) { } shinyApp(ui, server)
checkboxInput

sliderInput
- This produces a slider that allows the user to do one of two things
- Select a single numerical value from a range of numbers
- Select two numerical values from a range of numbers
- For users to select a single value, we need to set
minandmax - The initial value is determined by
value - Step size is determined by
step
ui <- fluidPage( titlePanel("Sleeping habits in America"), sliderInput("sliderlabel", "Average hours of sleep",min = 7.5, max = 11,value = 9,step = 0.02))server <- function(input, output, session) { } shinyApp(ui, server)
sliderInput

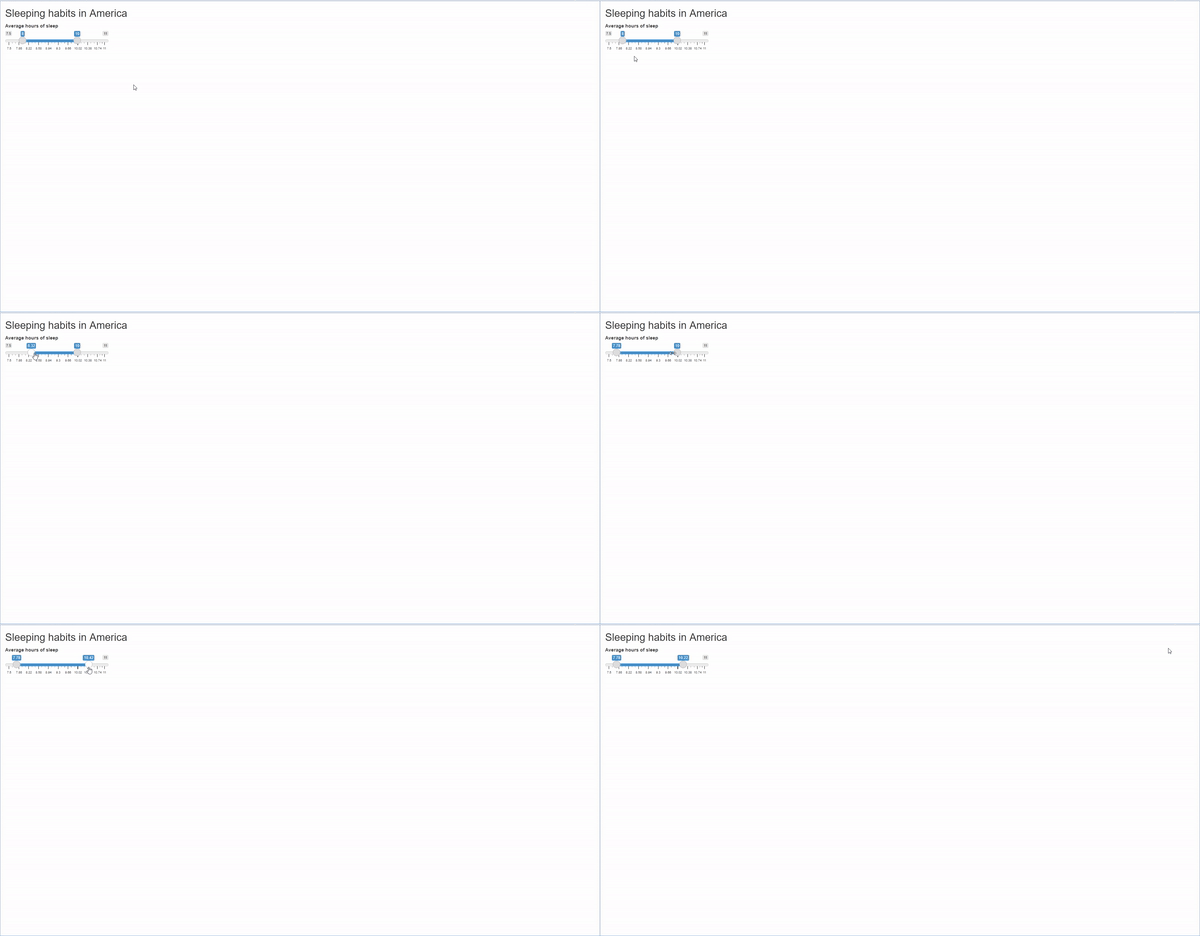
sliderInput with ranges
- The slider can be made two-sided if value is set as a length 2 vector
ui <- fluidPage( titlePanel("Sleeping habits in America"), sliderInput("sliderlabel", "Average hours of sleep", min = 7.5, max = 11,value = c(8, 10),step = 0.02)) server <- function(input, output, session) { } shinyApp(ui, server)
sliderInput with ranges
Let's practice!
Building Dashboards with shinydashboard

