Types of output
Building Dashboards with shinydashboard

Png Kee Seng
Researcher
textOutput rendered

textOutput with interactions

plotOutput rendered
plotOutput with selectInput
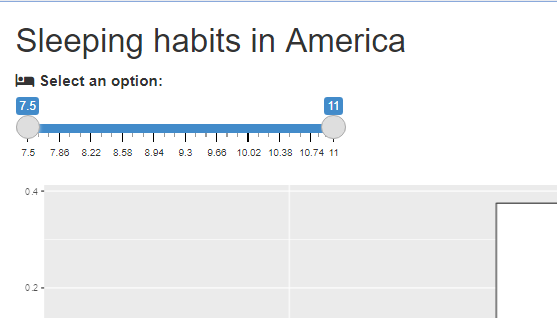
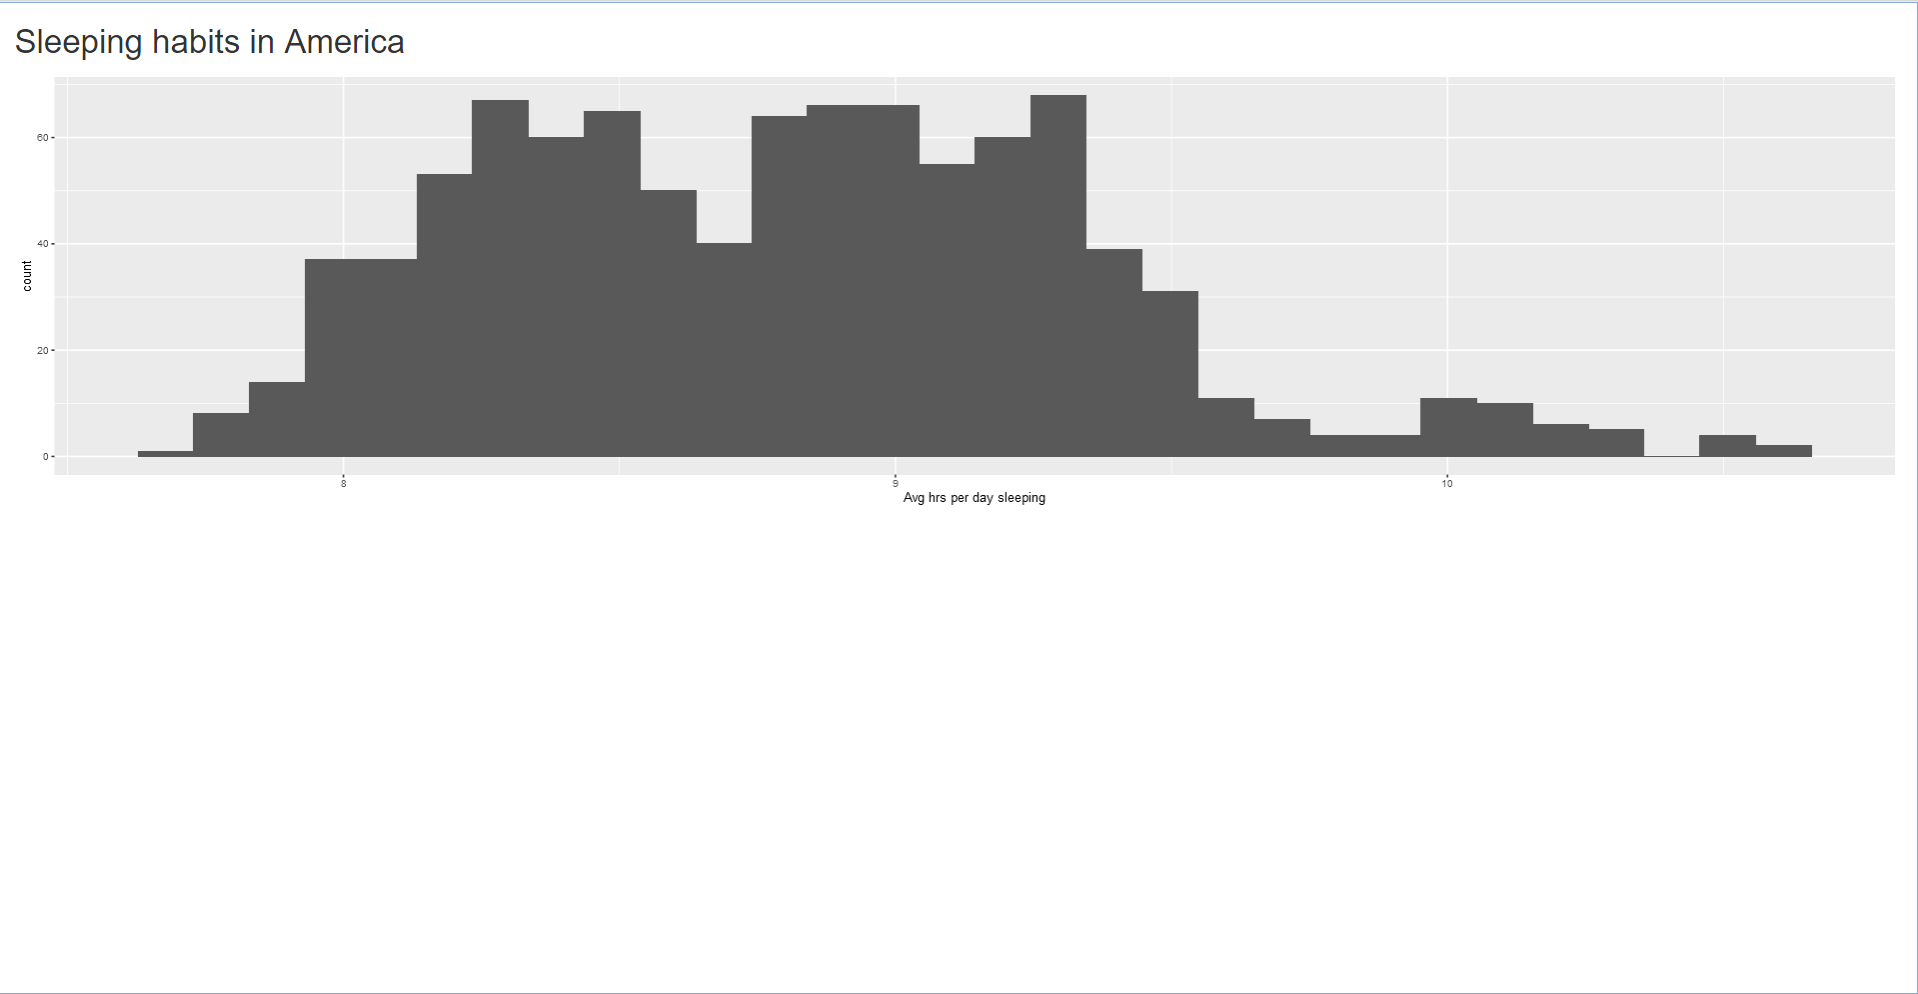
plotOutput with sliderInput
Icons in shiny
shinyalso contains icons that can be used in a shinyApp
![]()
1 https://fontawesome.com/icons
Rendered app with icon