The header and sidebar
Building Dashboards with shinydashboard

Png Kee Seng
Researcher
The header


1 Image by upklyak on Freepik
The shinydashboard title
header <- dashboardHeader(title = "Soccer tournament")
header <- dashboardHeader(title = "Analysis for global soccer tournament")
header <- dashboardHeader(title = "Analysis for global soccer tournament")
                            titleWidth = 400)
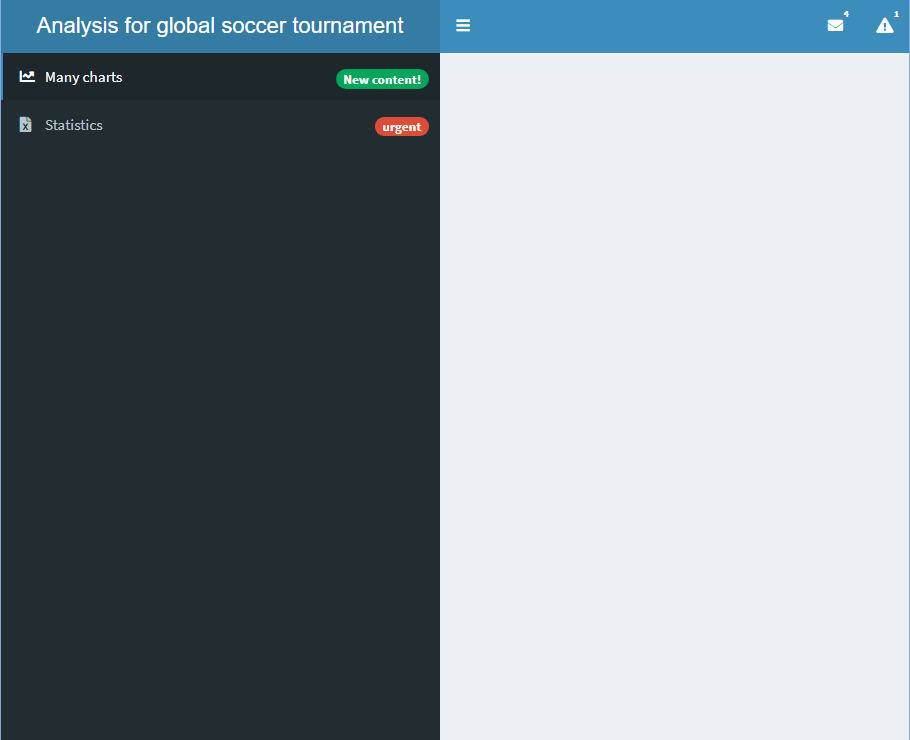
Adding a dropdown menu with a message
header <- dashboardHeader( title = "Analysis for FIFA world cup", titleWidth = 300, dropdownMenu(type = "messages",messageItem("Data division", "Keep up the good work!",time = "5 mins")))

Adding a dropdown menu with multiple messages
- Add another
messageItem()withindropdownMenu()called "Twitter"

Adding a dropdown menu with multiple items

Adding more dropdown menus
- We can also add another dropdown menu
The sidebar
- The sidebar is defined by
dashboardSidebar() - The width of the sidebar can be adjusted by setting
width. sidebarMenu()allows us to place several pages in a shinydashboard

Adding a badge
- A badge can also be added
- Set
badgeLabelandbadgeColor
- Set
Adding subtabs
- Subtabs can be added by adding
menuSubItem() - Note that badges cannot be added to a tab containing subtabs

Adding inputs and outputs in the sidebar
- Inputs and outputs can be added to the sidebar
- We also have to define inputs and outputs in
server


