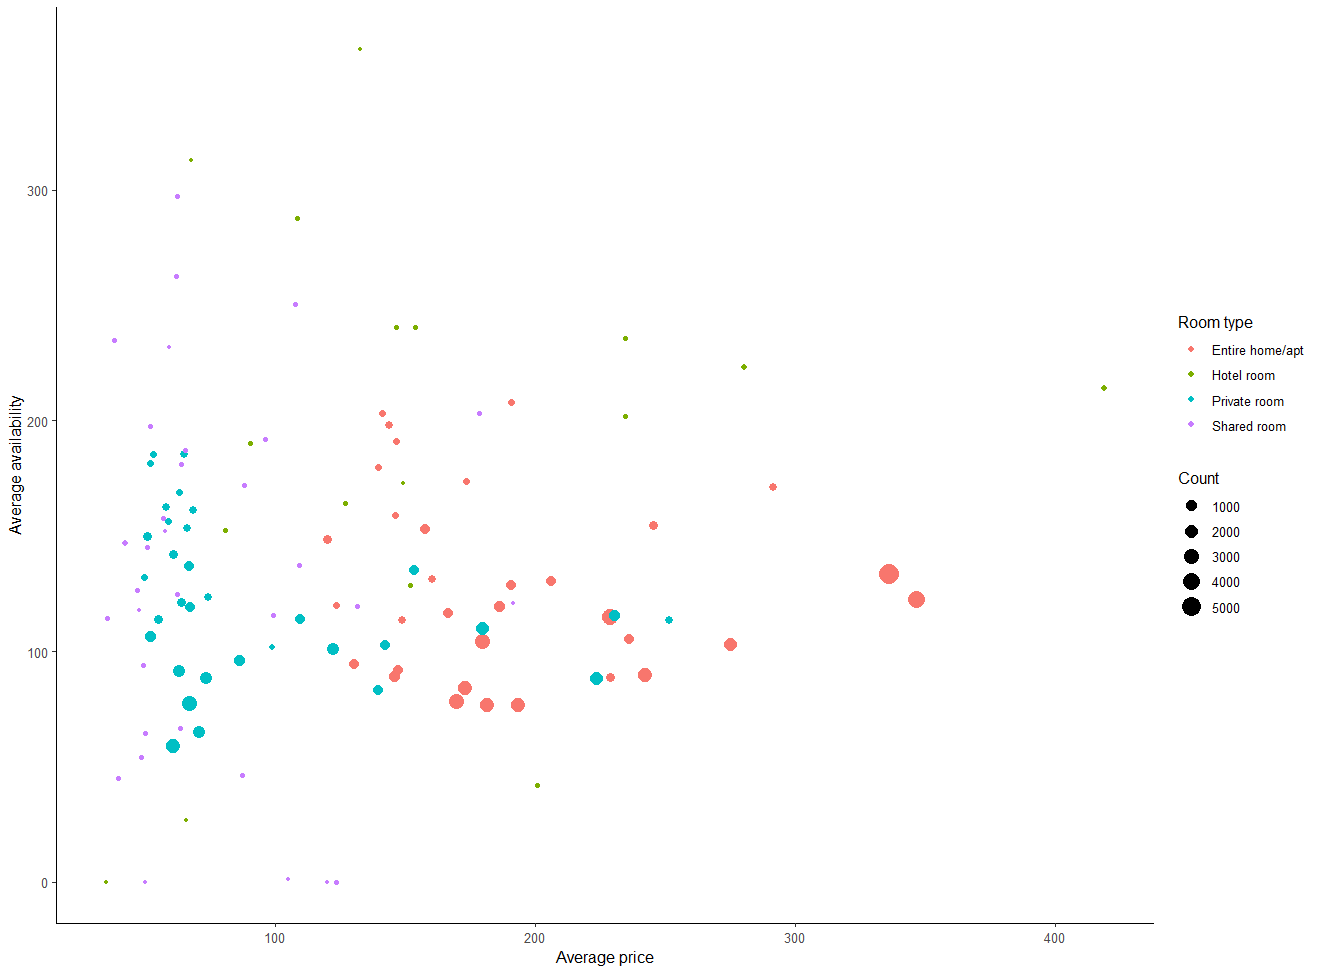
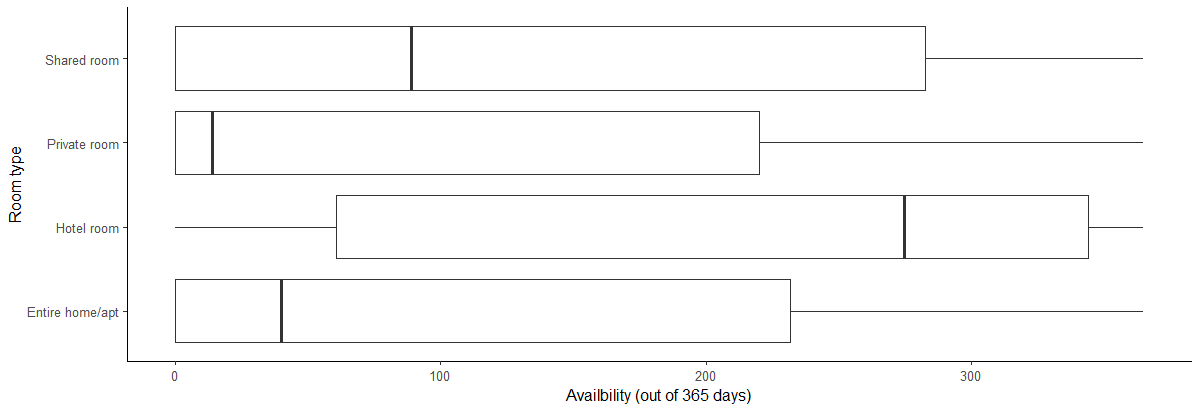
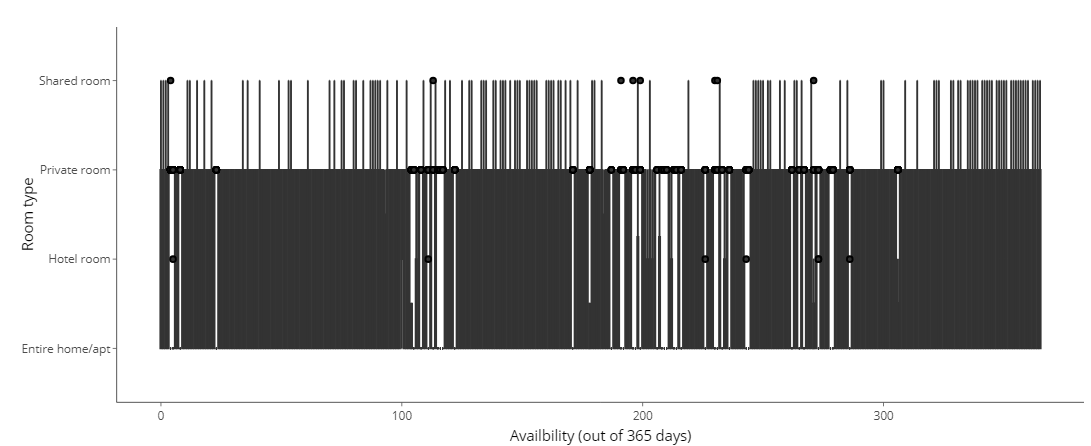
Building Dashboards with shinydashboard
Png Kee Seng
Researcher
library(tidyverse)
listings <- read_csv("../data/listings.csv")
...
$ host_name : chr [1:69351] "Susie" "Alina" "Luca" "Simon" ...
$ neighbourhood_group : logi [1:69351] NA NA NA NA NA NA ...
$ neighbourhood : chr [1:69351] "Tower Hamlets" "Islington" "Tower Hamlets" "Islington" ...
$ latitude : num [1:69351] 51.5 51.6 51.5 51.5 51.5 ...
$ longitude : num [1:69351] -0.054 -0.1127 -0.0743 -0.1048 -0.2 ...
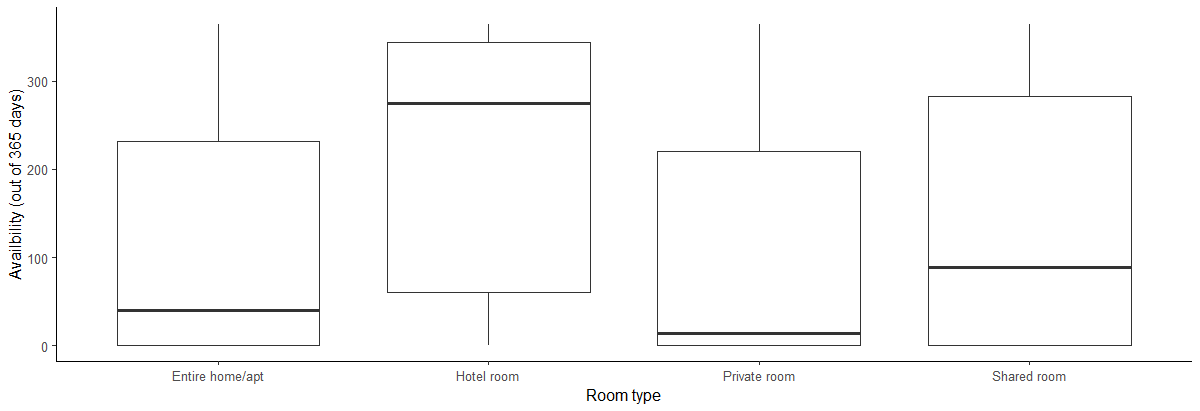
$ room_type : chr [1:69351] "Private room" "Private room" "Entire home/apt" "Private room" ...
$ price : num [1:69351] 55 50 90 180 297 75 204 379 90 30 ...
$ minimum_nights : num [1:69351] 3 1 5 4 14 3 2 4 3 7 ...
$ number_of_reviews : num [1:69351] 65 30 42 493 6 89 581 51 104 32 ...
$ last_review : Date[1:69351], format: "2016-06-10" "2022-07-15" "2022-01-04" "2022-09-02" ...
$ reviews_per_month : num [1:69351] 0.47 0.2 0.34 3.59 0.05 0.57 4.26 0.36 0.86 0.29 ...
$ calculated_host_listings_count: num [1:69351] 1 2 1 5 1 1 1 5 1 1 ...
$ availability_365 : num [1:69351] 74 343 222 236 180 70 193 249 318 251 ...
...
Import the plotly library
library(plotly)
A plotly object is defined by placing a ggplot object within ggplotly()
ggplotly(<ggplot object>)
bubbleprice and availability_365room_typebubble <- listings %>%group_by(room_type, neighbourhood) %>% summarise(avg_price = mean(price, na.rm=TRUE), avg_availability = mean(availability_365, na.rm=TRUE),Count = n(), .groups = "drop") %>%ggplot(aes(x = avg_price, y = avg_availability,color = room_type,size = Count)) +geom_point() +labs(x = "Average price", y = "Average availability", color = "Room type") + theme_classic()
bubble in ggplotly()ggplotly(bubble)

Some plots cannot be converted correctly
Create a series of horizontally oriented boxplots
availability_365 distribution with respect to room_typeggplotly() does not workboxH <- listings %>%ggplot(aes(x = availability_365, y=room_type)) +geom_boxplot() +labs(x="Availbility (out of 365 days)", y="Room type") + theme_classic()
ggplotly(boxH)
x and y in aes()boxV <- listings %>%ggplot(aes(y = availability_365, x=room_type)) + geom_boxplot() + labs(y="Availbility (out of 365 days)", x="Room type") + theme_classic()
ggplotly(boxV)

coord_flip()facet_wrap()ggplotly(boxV + coord_flip())
ggplotly(boxV + coord_flip() +
facet_wrap(~neighbourhood))


Building Dashboards with shinydashboard