Why transform existing features?

Feature Engineering in R

Jorge Zazueta

Research Professor. Head of the Modeling Group at the School of Economics, UASLP
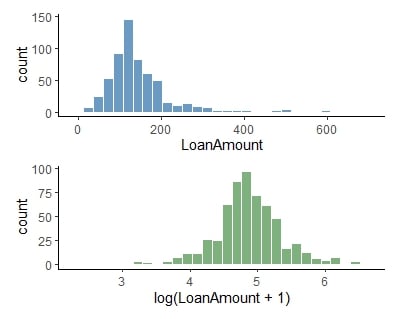
Making your model's life easier

We can improve the performance of our machine-learning model by making the data more manageable.

glimpse(loans_num)
Rows: 614
Columns: 6
$ Loan_Status       <fct> Y, N, Y, Y, Y, Y, Y, N, Y, N, Y, Y, Y, N...
$ ApplicantIncome   <dbl> 5849, 4583, 3000, 2583, 6000, 5417, 233...
$ CoapplicantIncome <dbl> 0, 1508, 0, 2358, 0, 4196, 1516, 2504, 1...
$ LoanAmount        <dbl> NA, 128, 66, 120, 141, 267, 95, 158, 168...
$ Loan_Amount_Term  <dbl> 360, 360, 360, 360, 360, 360, 360, 360, ...
$ Credit_History    <fct> 1, 1, 1, 1, 1, 1, 1, 0, 1, 1, 1, 1, 1, 1...
Feature Engineering in R

Log transformation

log-transform numerical features to:

  • Handle skewed data
  • Reduce the impact of outliers
  • Convert multiplicative relations into additive
  • Make the data more suitable for modeling
  • Works only for positive values

log-transformed loan amount data
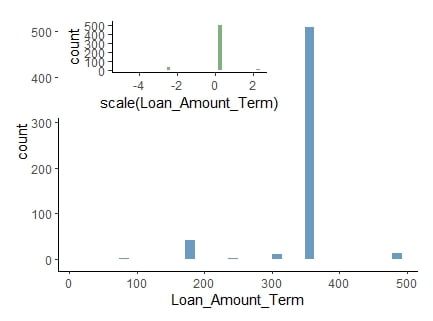
Graphical comparison of raw and log-transformed data

Feature Engineering in R

Normalization

Normalize or scale numerical features to:

  • Prevent one feature from dominating the others
  • Ease interpretation because it gives a comparable magnitude and
  • Make the data more suitable for modeling

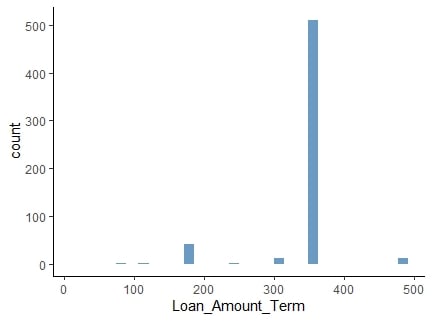
e.g., loan amount term values shown vary significantly

Histogram showing loan amount values.

Feature Engineering in R

Normalization

Normalize or scale numerical features to:

  • Prevent one feature from dominating the others
  • Help handle outliers and
  • Missing data
  • Make the data more suitable for modeling

Normalized values preserve distribution, but contain variation.

Histogram showing loan amount values overlaid by normalized data.

Feature Engineering in R

Defining the model and the recipe

We can now declare a logistic regression model and add a recipe to impute, normalize and log-transform the relevant features.

lr_model <- logistic_reg()

lr_recipe <- 
  recipe(Loan_Status ~., 
         data = train) %>%
  step_impute_knn(
    all_numeric_predictors())%>%
  step_normalize(Loan_Amount_Term) %>%
  step_log(all_numeric_predictors(),
           -Loan_Amount_Term, offset = 1)

Printing the recipe object shows a summary of the steps applied.

lr_recipe
Recipe

Inputs:

      role #variables
   outcome          1
 predictor          5

Operations:

K-nearest neighbor imputation for all_numeric_predictors()
Centering and scaling for Loan_Amount_Term
Log transformation on all_numeric_predictors(),-Loan_Amount_Term
Feature Engineering in R

Measuring performance efficiently

We define a set of metrics, roc_auc, accuracy and sens to assess the fit workflow object lr_fit.

class_evaluate <- metric_set(
  roc_auc, accuracy, sens)

And run it as you would any function.

lr_aug %>% 
  class_evaluate(
    truth = Loan_Status, 
    estimate = .pred_class, 
    .pred_Y)

Customized set of metrics

# A tibble: 3 × 3
  .metric  .estimator .estimate
  <chr>    <chr>          <dbl>
1 accuracy binary         0.813
2 sens     binary         0.467
3 roc_auc  binary         0.288
Feature Engineering in R

Let's practice!

Feature Engineering in R

Preparing Video For Download...