Creating new features using domain knowledge

Feature Engineering in R

Jorge Zazueta

Research Professor and Head of the Modeling Group at the School of Economics, UASLP

The importance of domain knowledge

Domain knowledge enables us to identify and create relevant and useful features for a particular model or task.

Feature engineering is about creating new input features from existing ones.

Examples of domain knowledge:

  • Financial: The critical determinants of bankruptcy
  • Medical: Pre-existing conditions relevant to a specific treatment
  • Marketing: Distinguishing features of a consumer group
Feature Engineering in R

Creating variables based on professional experience

We want to predict hotel cancellations based on the following feature vector:

features <- 
c("IsCanceled", "LeadTime",
  "arrival_date",
  "StaysInWeekendNights",
  "StaysInWeekNights",
  "PreviousCancellations",
  "PreviousBookingsNotCanceled",
  "ReservedRoomType",
  "AssignedRoomType","BookingChanges",
  "DepositType","CustomerType",
  "ADR","TotalOfSpecialRequests")

Features form raw data

We can generate informative features fromarrival_date.

Arrival date can be decomposed in day of the week, week, month and holiday

But this becomes tedious quickly. We need to automate it!

Feature Engineering in R

The tidymodels framework

We'll use a workflow based on tidymodels, a collection of packages for modeling and machine learning using tidyverse principles (1) with emphasis on feature engineering.

Simple tidymodels workflow: load data, declare model, split data, set up recipe, bundle in workflow, fit workflow and assess performance.

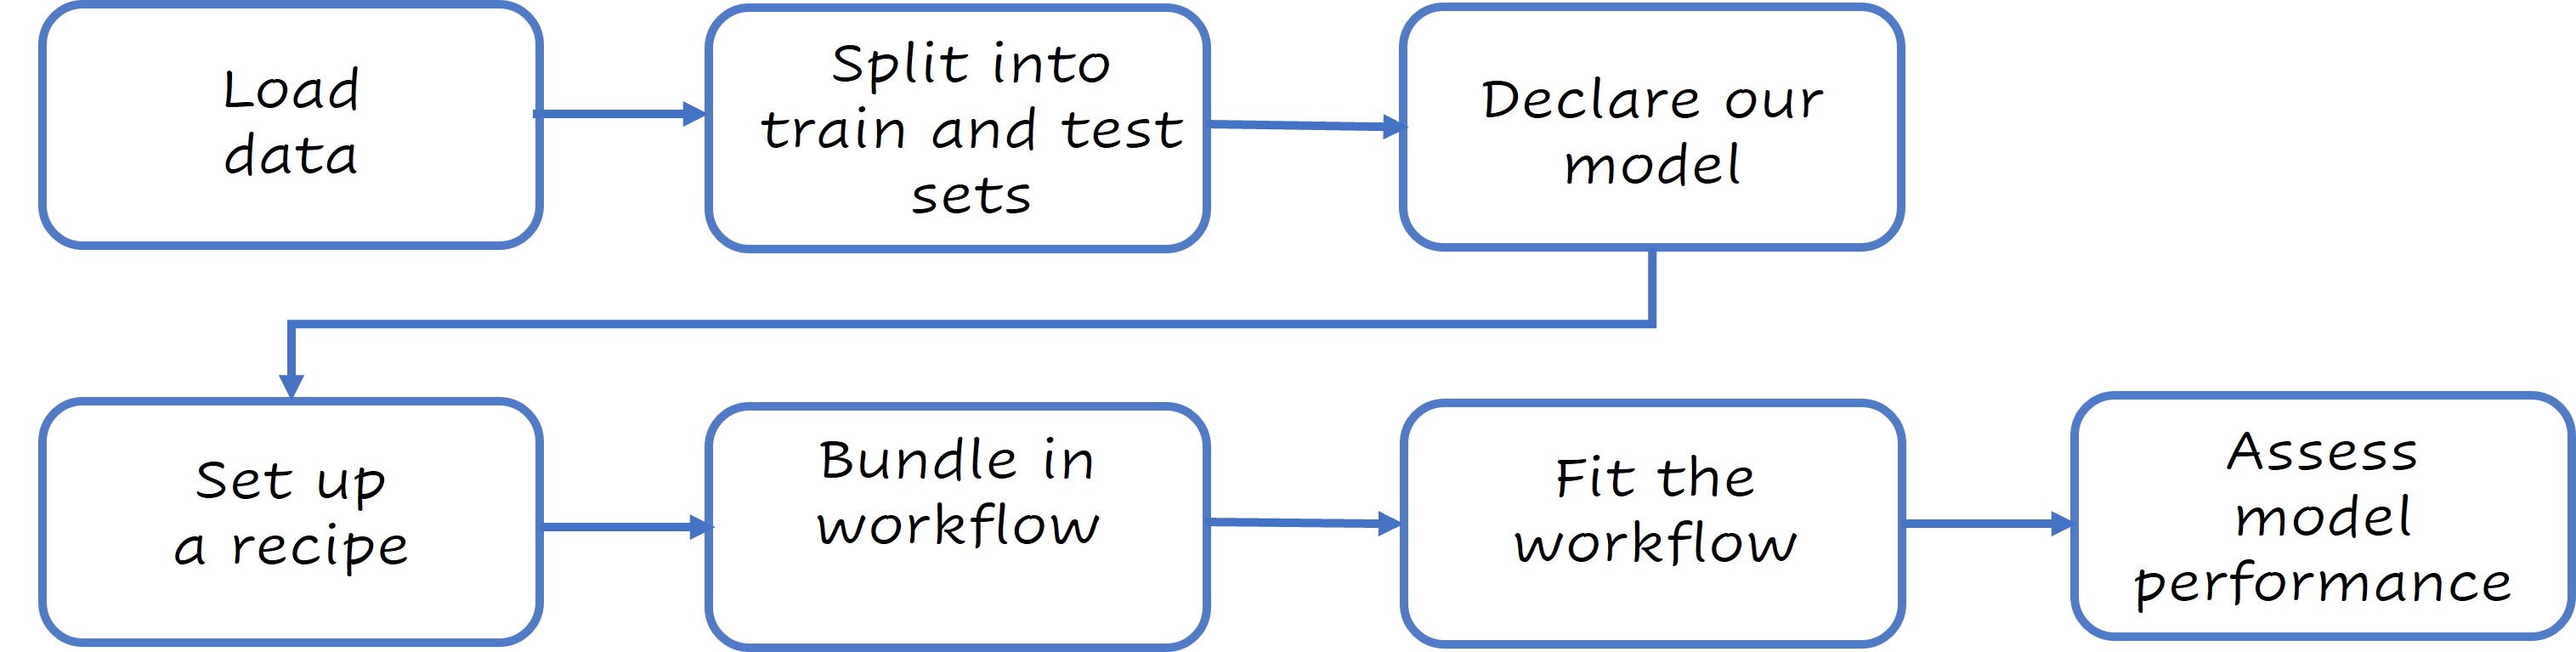
We can learn more at www.tidymodels.org

1 [Tidyverse guiding principles.](https://design.tidyverse.org/unifying-principles.html)
Feature Engineering in R

Setting up our data for analysis

Let's start by getting our data ready.

cancelations <- 
  cancelations %>% 
  mutate(across(where(is_character),as.factor))
set.seed(123)
split <- cancellations %>% 
    initial_split(
    strata = "IsCanceled")
train <- training(split)
test <- testing(split)

The prop parameter can be used to change the train/test data split (the default is 3/4).

initial_split(data, prop = 3/4, strata = NULL)

Verify that trainand test sets exhibit similar proportions of canceled reservations.

train %>% 
  select(IsCanceled) %>% table() %>% 
  prop.table()

IsCanceled
        0         1 
0.5826946 0.4173054
test %>% 
  select(IsCanceled) %>% table() %>% 
  prop.table()

IsCanceled
        0         1 
0.5827788 0.4172212
Feature Engineering in R

Building a workflow

Declare our model

lr_model <- logistic_reg()

Build a recipe

lr_recipe <- 
  recipe(IsCanceled ~., data = train) %>%
  update_role(Agent, new_role = "ID" ) %>%
  step_date(arrival_date, 
      features = c("dow", "week", "month")) %>%
  step_holiday(arrival_date, 
      holidays = timeDate::listHolidays("US")) %>%
  step_rm(arrival_date) %>%
  step_dummy(all_nominal_predictors())

Print lr_recipe

Recipe
Inputs:

      role #variables
        ID          1
   outcome          1
 predictor         13

Operations:

Date features from arrival_date
Holiday features from arrival_date
Variables removed arrival_date
Dummy variables from all_nominal_predictors()
Feature Engineering in R

Building a workflow

Bundle the model and the recipe into a workflow object.

lr_workflow <- 
  workflow()%>%
  add_model(lr_model)%>%
  add_recipe(lr_recipe)

Fit the workflow

lr_fit <- 
  lr_workflow %>%
  fit(data = train)
Feature Engineering in R

Building a workflow

We can use tidy(lr_fit) to summarize our model.

# A tibble: 65 × 5
   term                        estimate std.error statistic   p.value
   <chr>                          <dbl>     <dbl>     <dbl>     <dbl>
 1 (Intercept)                 -1.92     0.228        -8.43 3.57e- 17
 2 LeadTime                     0.00414  0.000268     15.4  1.16e- 53
 3 StaysInWeekendNights         0.0860   0.0382        2.25 2.45e-  2
 4 StaysInWeekNights            0.0804   0.0185        4.34 1.40e-  5
 5 PreviousCancellations        2.39     0.147        16.2  2.45e- 59
 6 PreviousBookingsNotCanceled -0.440    0.0450       -9.77 1.45e- 22
 7 BookingChanges              -0.449    0.0463       -9.69 3.18e- 22
 8 ADR                          0.0104   0.000782     13.2  4.85e- 40
 9 TotalOfSpecialRequests      -0.727    0.0316      -23.0  5.29e-117
10 arrival_date_week            0.0245   0.0171        1.43 1.53e-  1
# … with 55 more rows
# ? Use `print(n = ...)` to see more rows
Feature Engineering in R

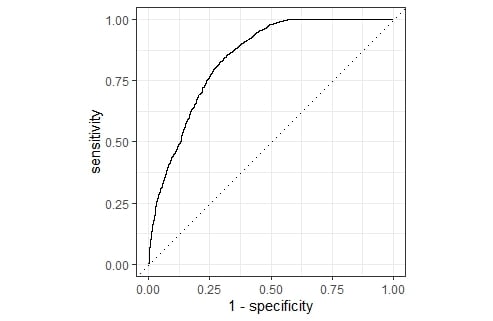
Assessing model performance

We can now assess our model's performance.

lr_aug <- lr_fit %>% augment(test)

bind_rows(
  lr_aug %>% 
  roc_auc(truth = IsCanceled,.pred_0),
  lr_aug %>% 
  accuracy(truth = IsCanceled,.pred_class))
# A tibble: 2 × 3
  .metric  .estimator .estimate
  <chr>    <chr>          <dbl>
1 roc_auc  binary         0.842
2 accuracy binary         0.782
lr_aug %>%
  roc_curve(truth = IsCanceled, .pred_0) %>%
  autoplot()

Receiver Operator Characteristic Curve of our model.

Feature Engineering in R

Let's practice!

Feature Engineering in R

Preparing Video For Download...