Feature hashing

Feature Engineering in R

Jorge Zazueta

Research Professor and Head of the Modeling Group at the School of Economics, UASLP

What is feature hashing?

  • Transforms a text variable into a set of numerical variables
  • Uses hash values as feature indices
  • Low memory representation of the data
  • Helpful when we expect new categories when new data is seen

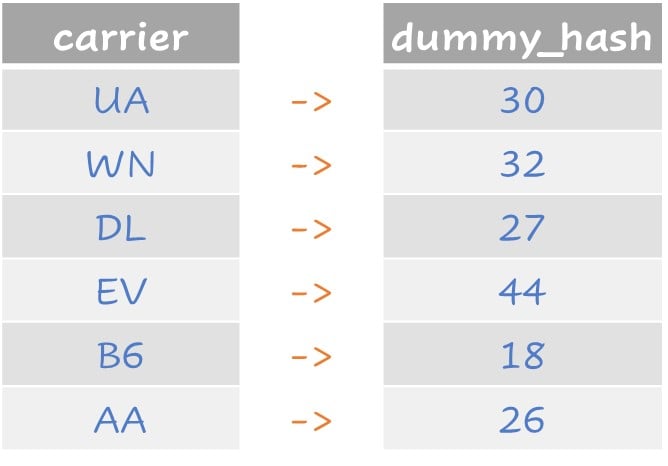
Assign an index number to each carrier based on text values.

Table illustrating feature hashing for airline carriers.

Feature Engineering in R

How many carriers are there?

The flights dataset includes carriers as factors, but we don't know if new carriers will appear when we look at new data.

flights %>%
  select(carrier) %>%
  table()
carrier
  9E   AA   AS   B6   DL   EV   F9   FL   HA   MQ   OO   UA   US   VX   WN   YV 
 859 1744   26 2503 2619 3014   38  186   14 1540    2 3367 1228  244  757   41
Feature Engineering in R

Let us hash that feature

We can assign create dummy hashes to represent the factor values. Using the textrecipes package.

recipe <- recipe(~carrier, 
                 data = flights_train) %>%
  step_dummy_hash(carrier, prefix = NULL, 
                  signed = FALSE, 
                  num_terms = 50L)
# Prep the recipe
object <- recipe %>%
  prep()

# Bake the recipe object with new data
baked <- bake(object,
              new_data = flights_test)

A peak at the step_dummy_hash() representation.

bind_cols(flights_test$carrier,baked)[1:6,c(1,18:20)]
New names:
• `` -> `...1`
# A tibble: 10 × 4
   ...1  `_carrier_17` `_carrier_18` `_carrier_19`
   <chr>         <int>         <int>         <int>
 1 EV                0             0             0
 2 B6                0             1             0
 3 EV                0             0             0
 4 MQ                0             0             0
 5 DL                0             0             0
 6 EV                0             0             0
Feature Engineering in R

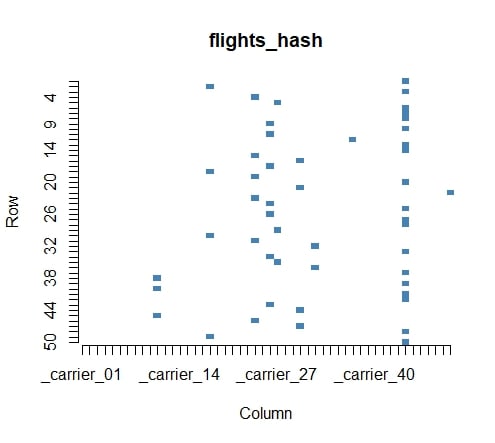
Visualizing the hashing

We can take a look at the matrix with the help of the plot.matrix package.

flights_hash <- 
    as.matrix(baked)[1:50,] 

plot(flights_hash, 
     col = c("white","steelblue"), 
     key = NULL,
     border = NA)

A graphical representation of a sample of the dummy hash assignments of the original carrier's factor.

Feature Engineering in R

Let's practice!

Feature Engineering in R

Preparing Video For Download...