Increasing the information content of raw data
Feature Engineering in R

Jorge Zazueta
Research Professor and Head of the Modeling Group at the School of Economics, UASLP
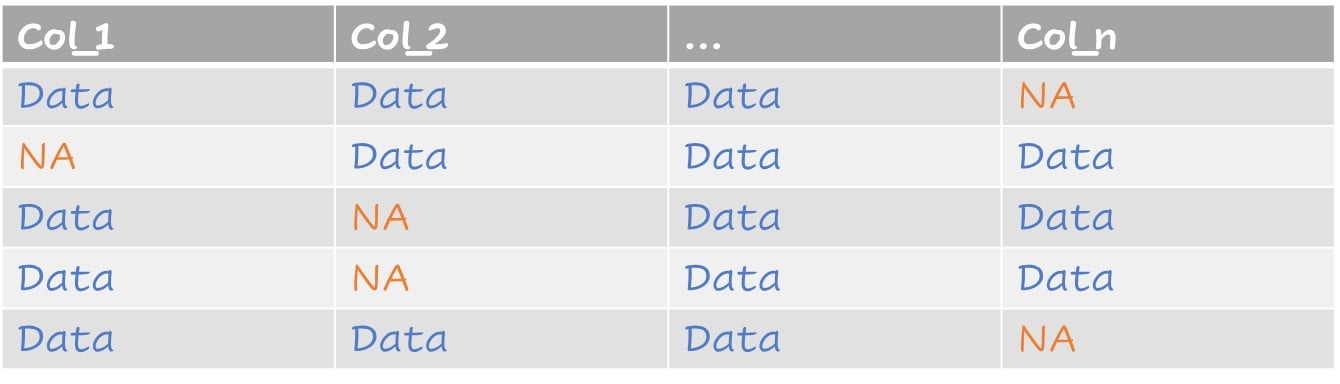
Dealing with raw data
A typical dataset with missing values
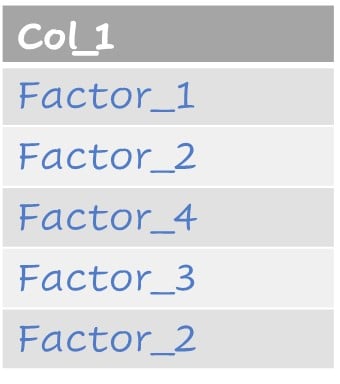
Values as factors
Dealing with raw data
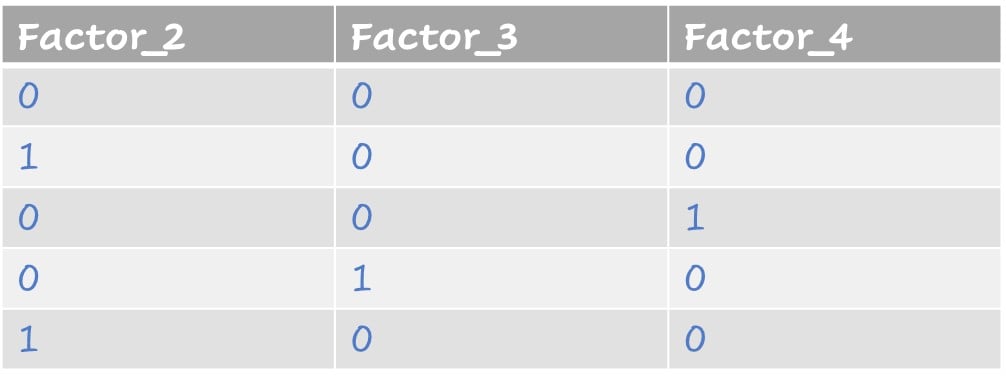
Dataset with imputed values
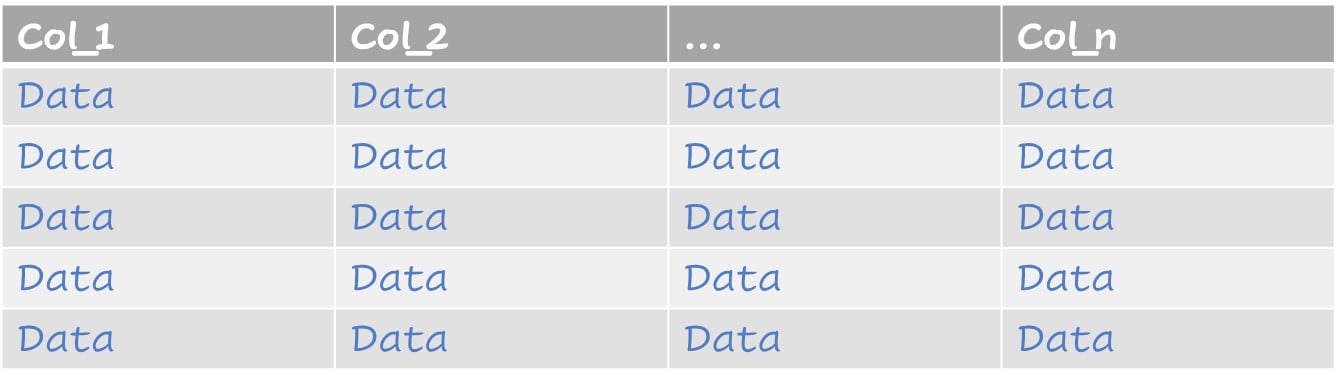
Factors represented as dummy variables
Missing values
We can visually identify missing values in loans using vis_miss(loans)from the package naniar.
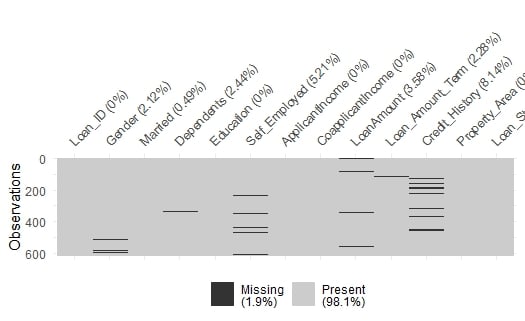
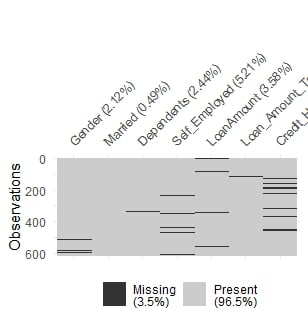
Missing values
A closer view of missing values
Finding the right recipe step
We can find other imputation methods and all recipe steps in the tidymodels documentations at www.tidymodels.org/find/recipes

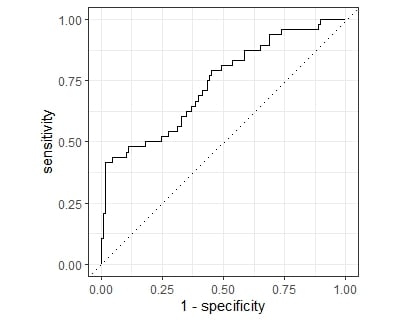
Fitting and assessing our model
# A tibble: 2 × 3
  .metric  .estimator .estimate
  <chr>    <chr>          <dbl>
1 roc_auc  binary         0.738
2 accuracy binary         0.792