Pearson correlation
A/B Testing in R

Lauryn Burleigh
Data Scientist
Pearson correlation assumptions
- Choosing correlation test: properties of data
- Pearson correlation
- Linear
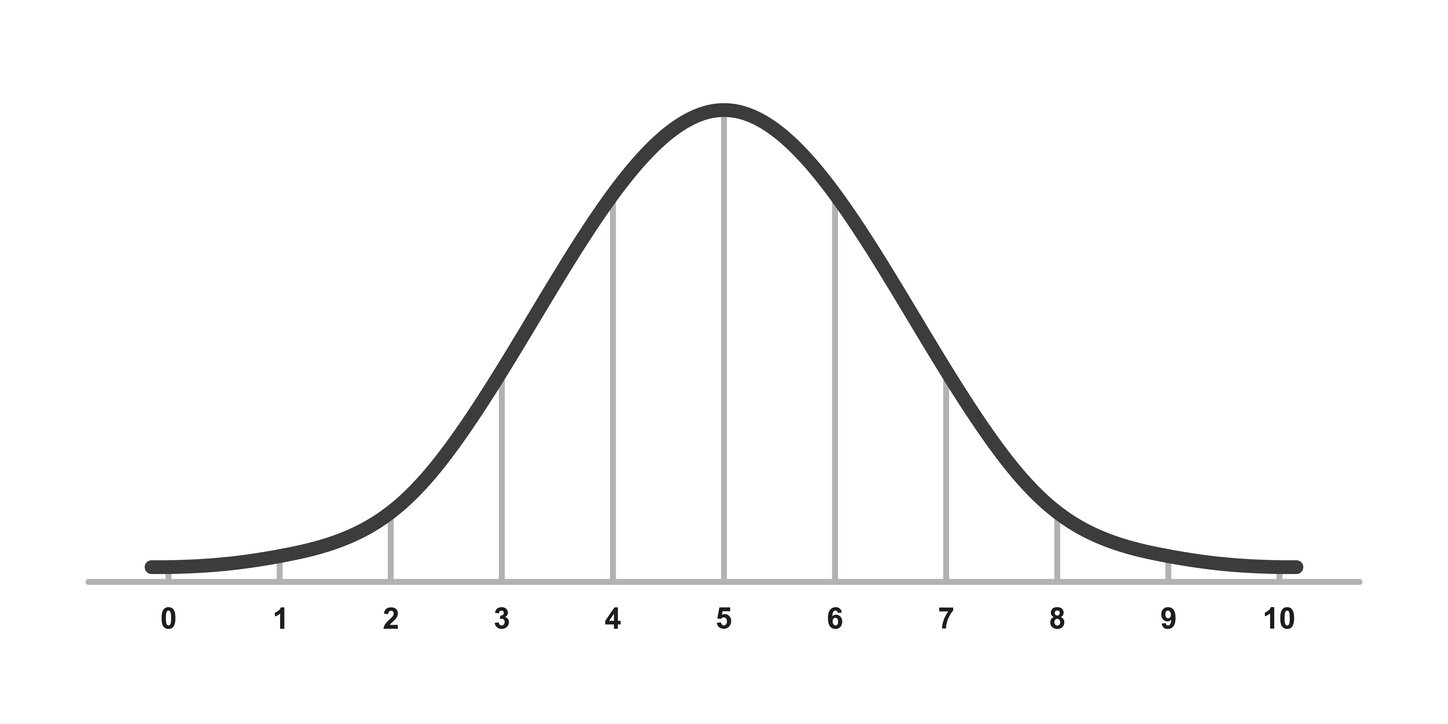
- Normal distribution


Pearson correlation and A/B tests
- Group A: Cheese pizza
- Group B: Pepperoni pizza
- Relationship of time to eat pizza and enjoyment
Ignoring groups
- Null hypothesis - no relationship between time to eat and enjoyment of the pizza
Each group
- Null hypothesis - no relationship between time to eat and enjoyment of the Cheese pizza
- Null hypothesis - no relationship between time to eat and enjoyment of the Pepperoni pizza
Determine sample size
rexpected effect (found withcor())sig.levelat which we reject the null
library(pwr)
pwr.r.test(r = 0.3, power = 0.80,
           sig.level = 0.05)
    approximate correlation power
 calculation (arctangh transformation)

              n = 84.07364
              r = 0.3
      sig.level = 0.05
          power = 0.8
    alternative = two.sided
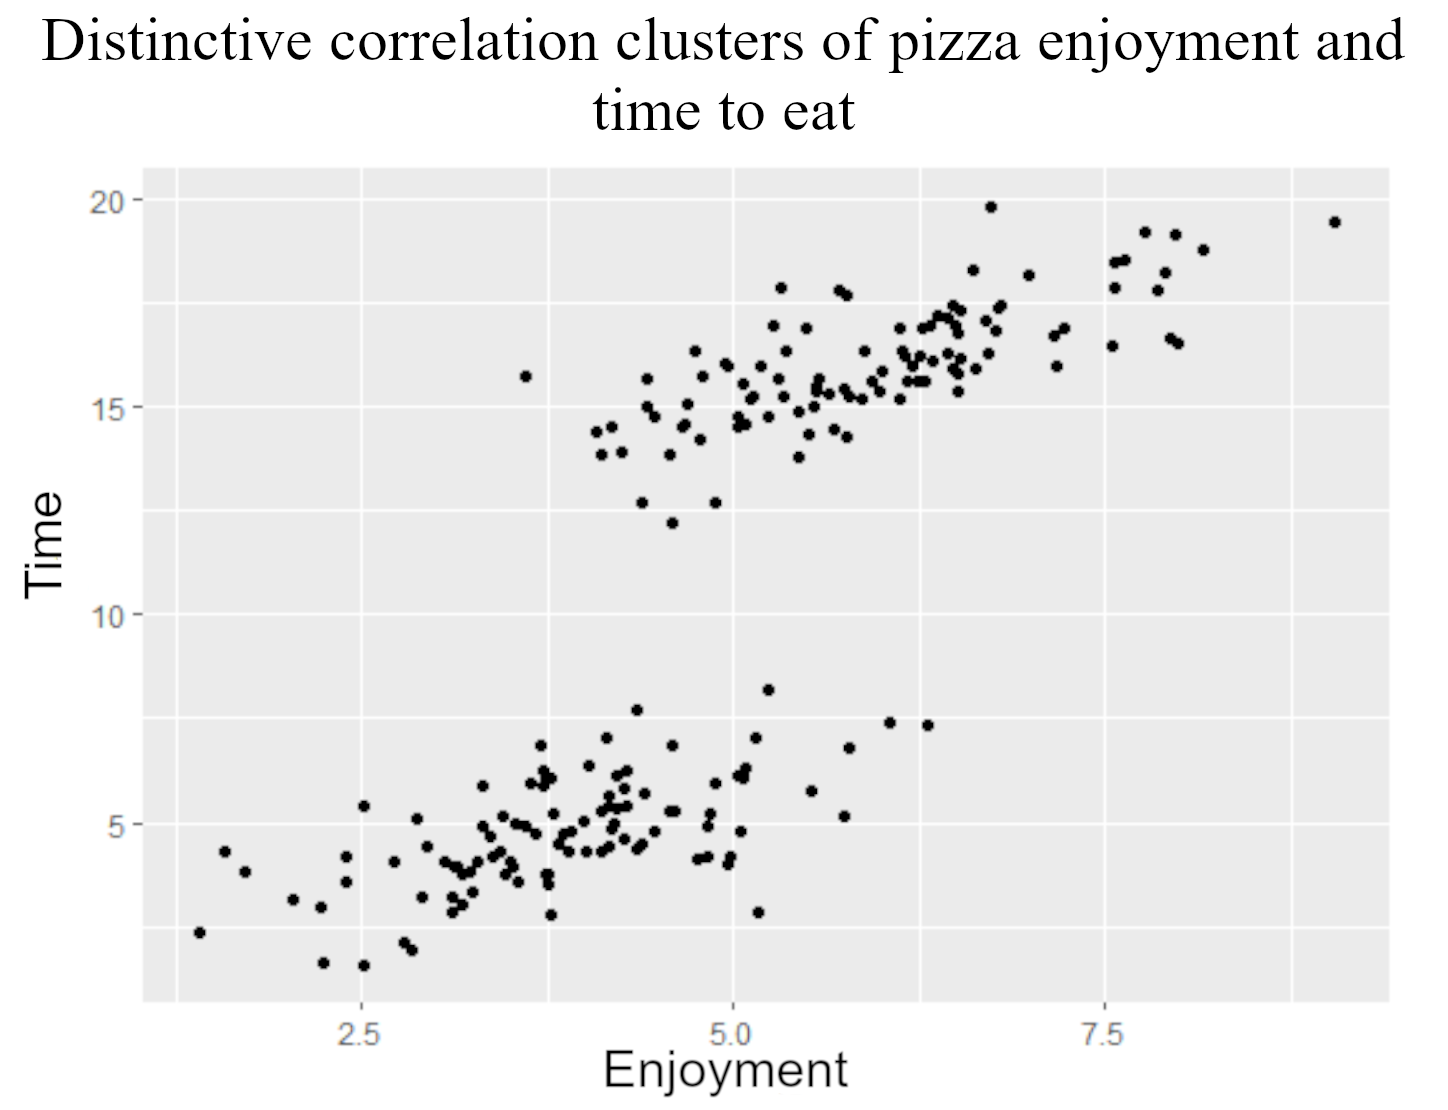
Assessing linearity
ggplot(pizza, aes(x = enjoyment,
                  y = time)) +
    geom_point()

ggplot(pizza, aes(x = enjoyment,
                  y = time)) +
    geom_point()

Assessing normality
shapiro.test(pizza$time)
    Shapiro-Wilk normality test
data:  pizza$time
W = 0.98686, p-value = 0.4282
- Data is normal
shapiro.test(pizza$enjoyment)
    Shapiro-Wilk normality test
data:  pizza$enjoyment
W = 0.98916, p-value = 0.5971
- Data is normal
Pearson ignoring groups
cor.test(~ time + enjoyment,
         data = pizza,
         method = "pearson")
Proportion of variance: cor^2
0.30^2
[1] 0.09
Pearson's product-moment correlation

data:  time and enjoyment
t = 22.304, df = 88, p-value = 0.0218
alternative hypothesis: true correlation
is not equal to 0
95 percent confidence interval:
 0.8833166 0.9479256
sample estimates:
      cor
0.3021878
Pearson within groups
cor.test(~ time + enjoyment,
         data = pizza,
         subset =
             (Topping == "Cheese"),
         method = "pearson")
Pearson's product-moment correlation

data:  Time and Enjoy
t = 11.121, df = 98, p-value < 2.2e-16
alternative hypothesis: true correlation
is not equal to 0
95 percent confidence interval:
 0.6451710 0.8226595
sample estimates:
     cor
0.746935
Power analysis
Pearson ignoring groups:
Pearson's product-moment correlation

data:  time and enjoyment
t = 22.304, df = 88, p-value = 0.0218
alternative hypothesis: true
correlation is not equal to 0
95 percent confidence interval:
 0.8833166 0.9479256
sample estimates:
      cor
0.3021878
library(pwr)
pwr.r.test(r = 0.302, n = 100,
           sig.level = 0.022)
     approximate correlation power
  calculation (arctangh transformation)

              n = 100
              r = 0.302
      sig.level = 0.022
          power = 0.7853514
    alternative = two.sided
Let's practice!
A/B Testing in R

