A/B testing and design
A/B Testing in R

Lauryn Burleigh
Data Scientist
A/B testing
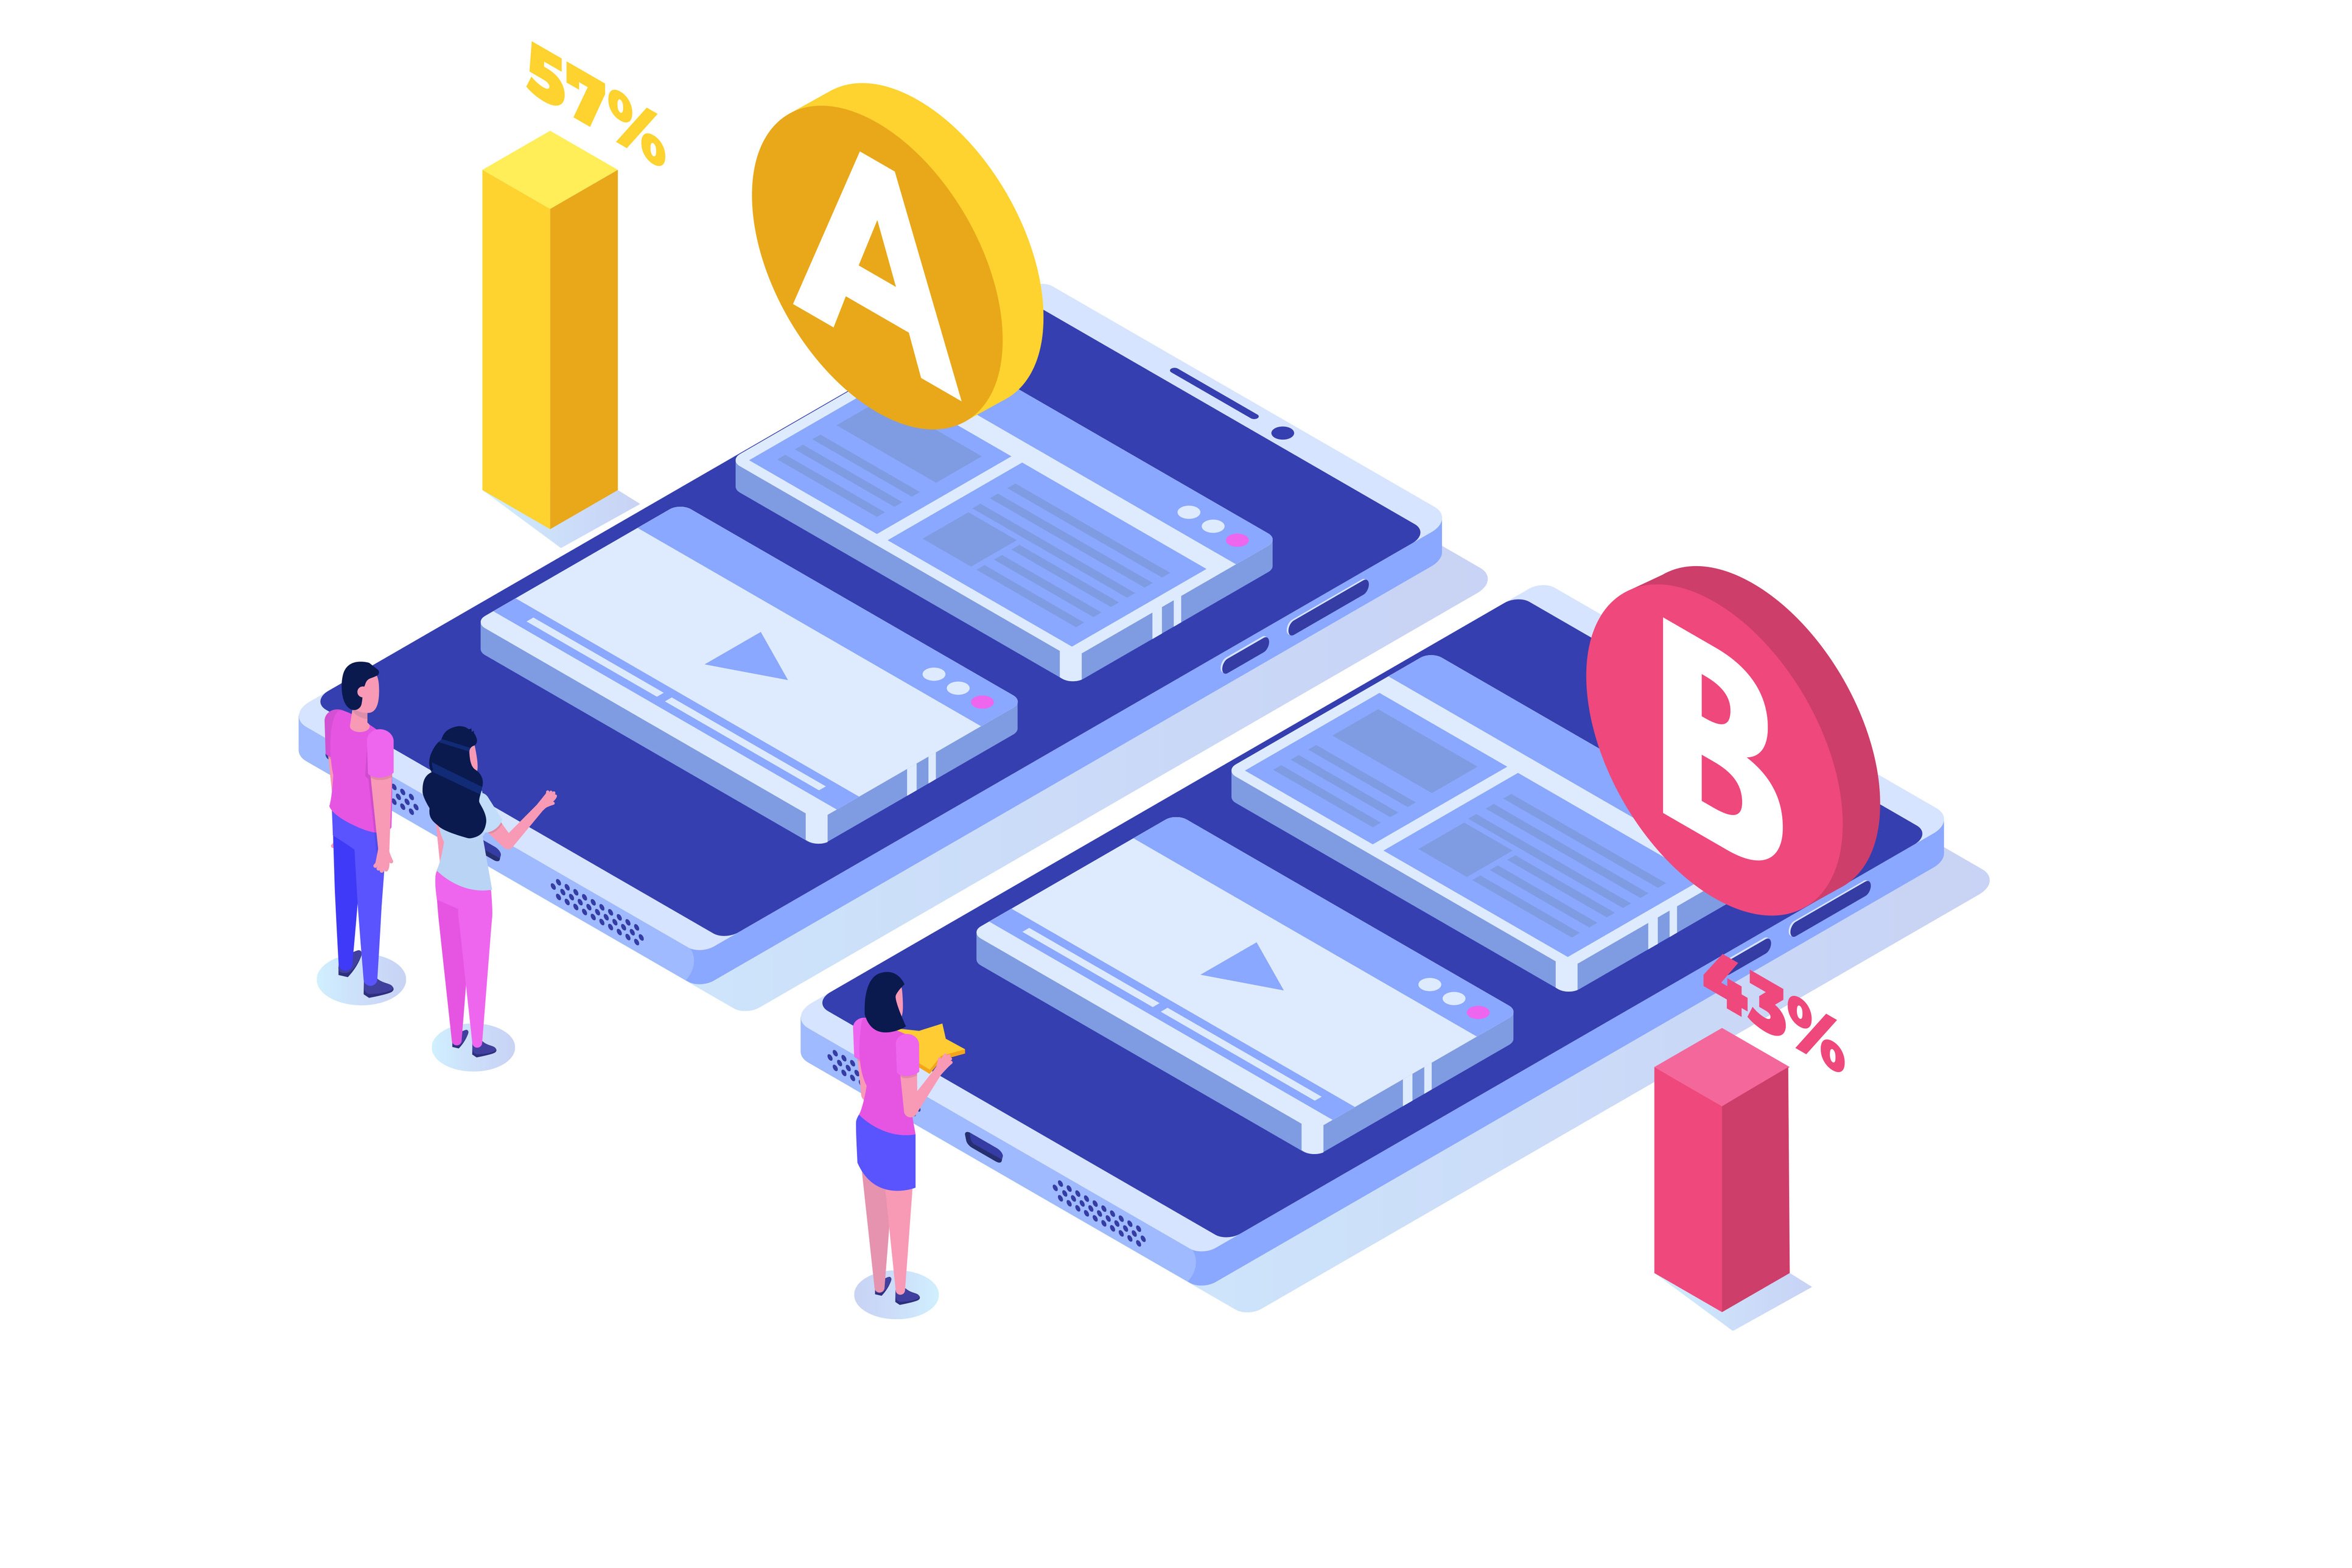
A/B design
- Between-Subjects design
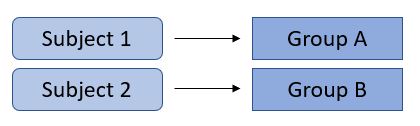
Control group
Group A
- Control group
Group B
- Experimental group
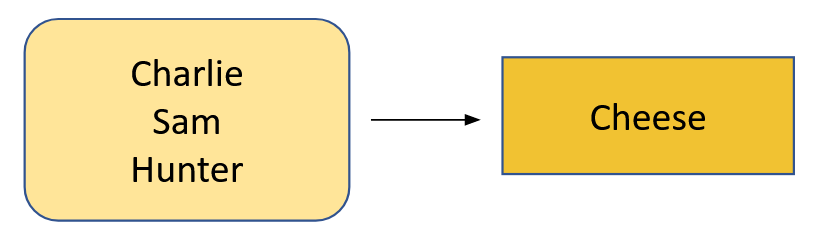
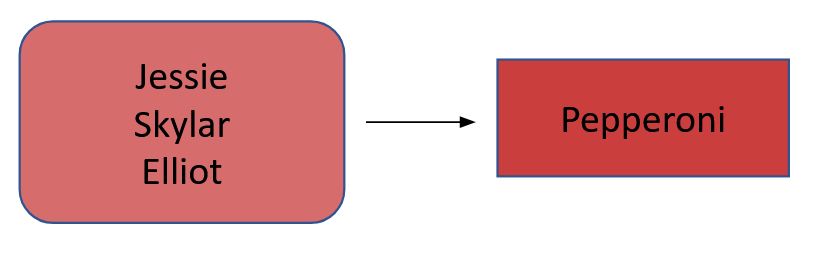
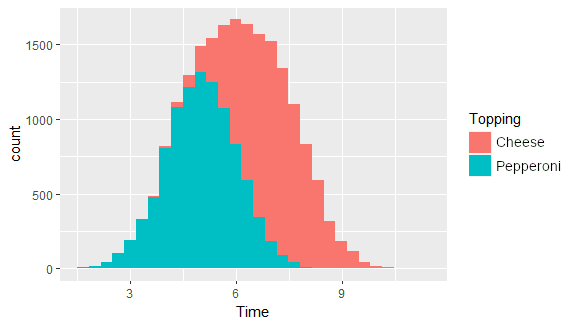
Visualize groupings
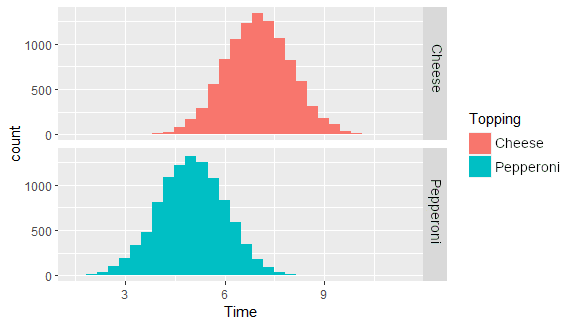
Separate groupings
A/B Testing in R
Lauryn Burleigh
Data Scientist
Group A
Group B

