A/B testing and design
A/B Testing in R

Lauryn Burleigh
Data Scientist
A/B testing
- Statistical technique
- Data-driven decisions
- Test differences and relationships
- Ideal for:
- Optimizing marketing campaigns, testing websites and advertisements
In this course:
- Analyze A/B data
- Make decisions and predictions

A/B design
- Impact of a condition:
- Time to eat Cheese or Pepperoni pizza
- Group A: Cheese pizza
- Group B: Pepperoni pizza
- Between-Subjects design
Control group
Group A

- Control group
Group B

- Experimental group
Data frame organization
Wide Format
- Groups in different columns
- NAs because of between-subjects design
| ID | Cheese | Pepperoni |
|---|---|---|
| 01 | 5.21 | NA |
| 02 | 3.75 | NA |
| 03 | 6.32 | NA |
| 04 | NA | 6.53 |
| 05 | NA | 7.01 |
| 06 | NA | 6.98 |
Long Format
- Groups denoted in one column
- Preferred format
| ID | Topping | Time |
|---|---|---|
| 01 | Cheese | 5.21 |
| 02 | Cheese | 3.75 |
| 03 | Cheese | 6.32 |
| 04 | Pepperoni | 7.64 |
| 05 | Pepperoni | 7.98 |
| 06 | Pepperoni | 5.62 |
Wide to long format
| ID | Cheese | Pepperoni |
|---|---|---|
| 01 | 5.21 | NA |
| 02 | 3.75 | NA |
| 03 | NA | 6.53 |
| 04 | NA | 7.01 |
| ID | Topping | Time |
|---|---|---|
| 01 | Cheese | 5.21 |
| 02 | Cheese | 3.75 |
| 03 | Pepperoni | 7.64 |
| 04 | Pepperoni | 7.98 |
library(tidyr)longdf <- Pizza %>% pivot_longer(cols = c("Cheese", "Pepperoni"),names_to = "Topping", values_to = "Time") %>%na.omit()
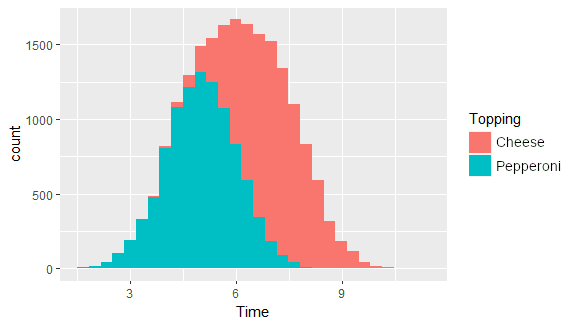
Visualize groupings
library(ggplot2)

ggplot(Pizza, aes(x = Time,
                  fill = Topping)) +
geom_histogram()

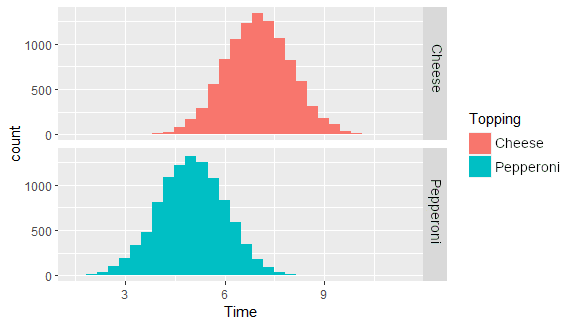
Separate groupings
library(ggplot2) ggplot(Pizza, aes(x = Time, fill = Topping)) +geom_histogram() + facet_grid(Topping~.)

A/B test hypotheses
Compare measure between groups
- Cheese pizza is enjoyed a different amount than Pepperoni pizza
- Cheese pizza is eaten at a different speed than Pepperoni pizza
Difference between conditions
Relationship of measure in groups
- Enjoyment is associated with speed of eating
- Both Cheese and Pepperoni groups: enjoyment of pizza is associated with speed of eating pizza
- One group (Cheese): enjoyment of Cheese pizza is associated with speed of eating Cheese pizza
Trend between measures
Let's practice!
A/B Testing in R


