Spearman-rank correlation

A/B Testing in R

Lauryn Burleigh

Data Scientist

Spearman correlation assumptions

  • Rank ordered - ordered by position
  • High Spearman correlation - similar positions in the two variables
  • Continuous or discrete data
    • Ordinal, interval, or ratio

Image of four bars in order of highest to lowest with the highest bar being 1 and lowest bar as 4.

A/B Testing in R

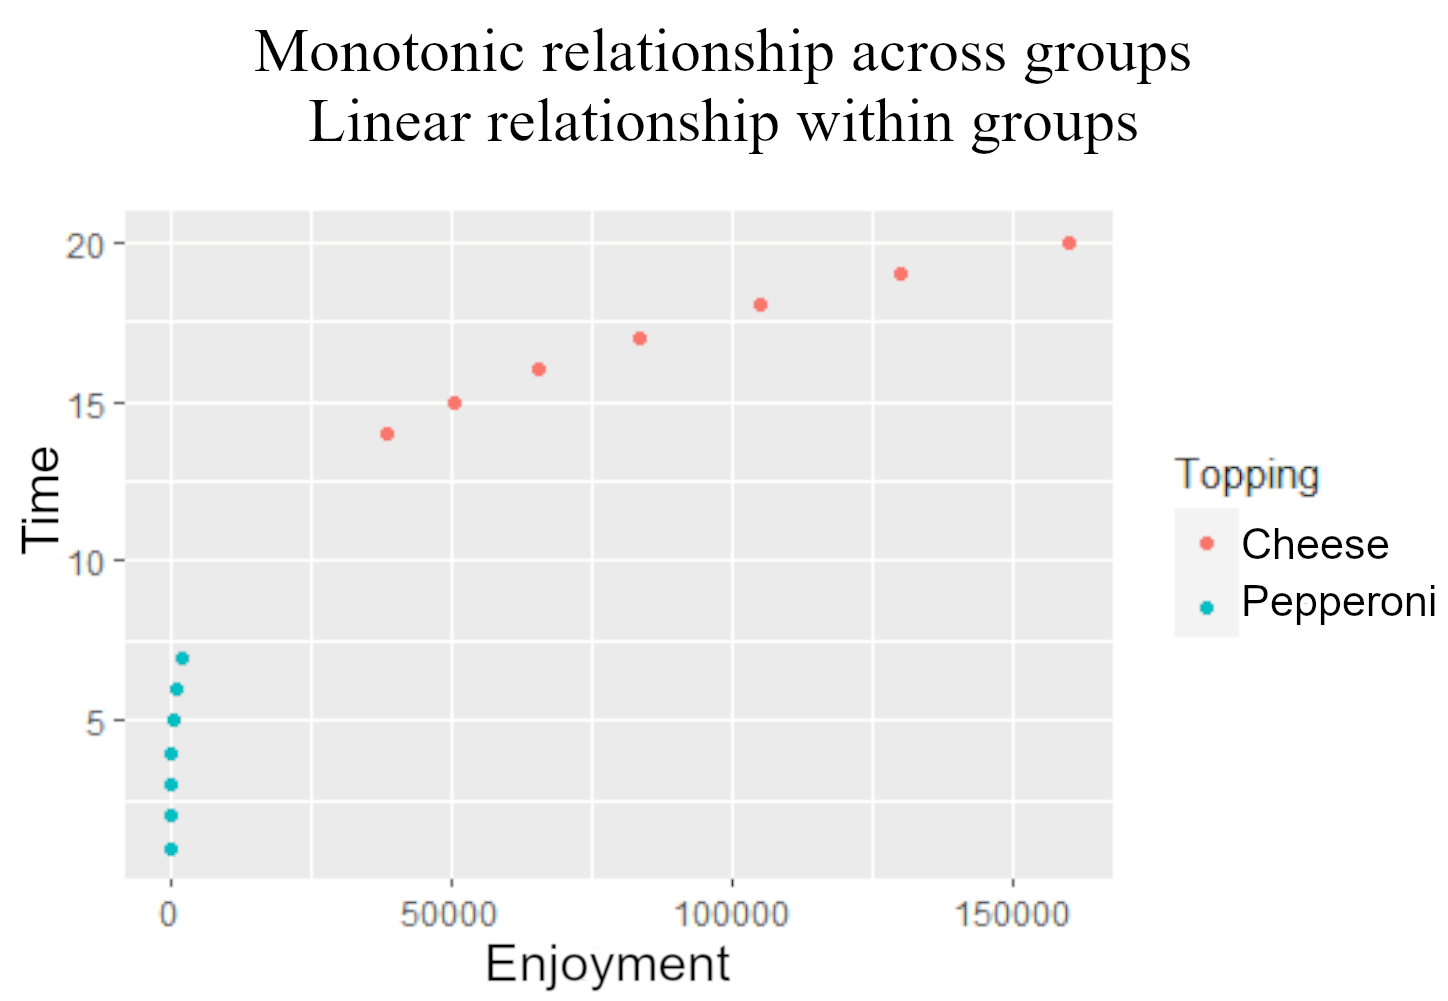
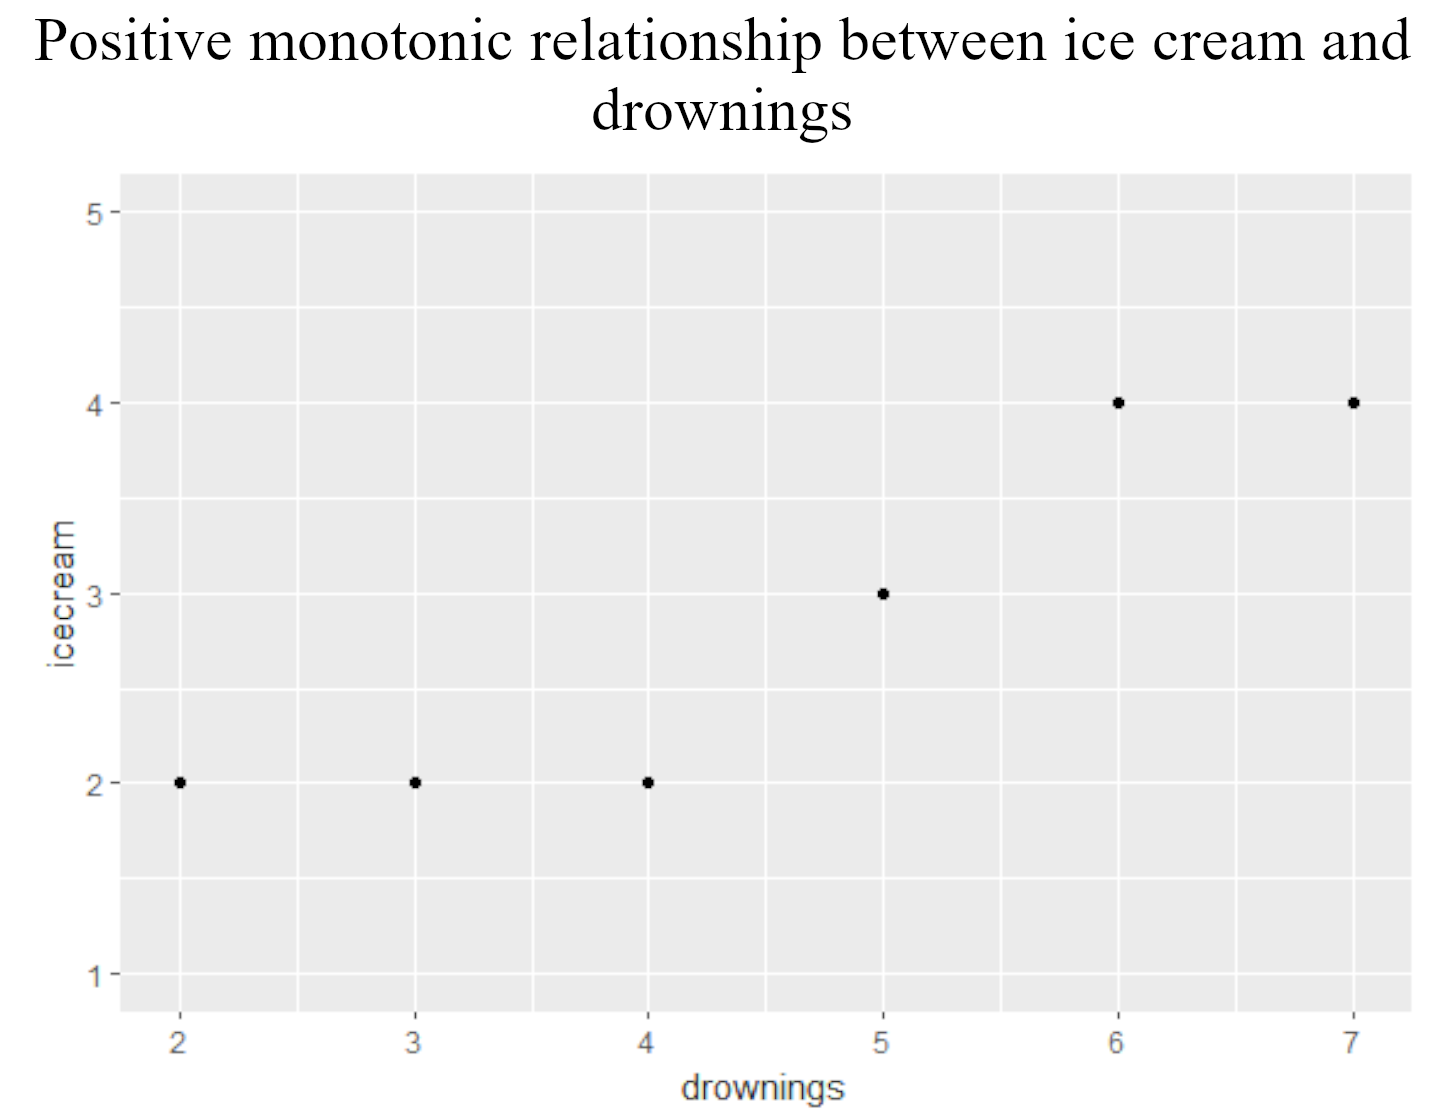
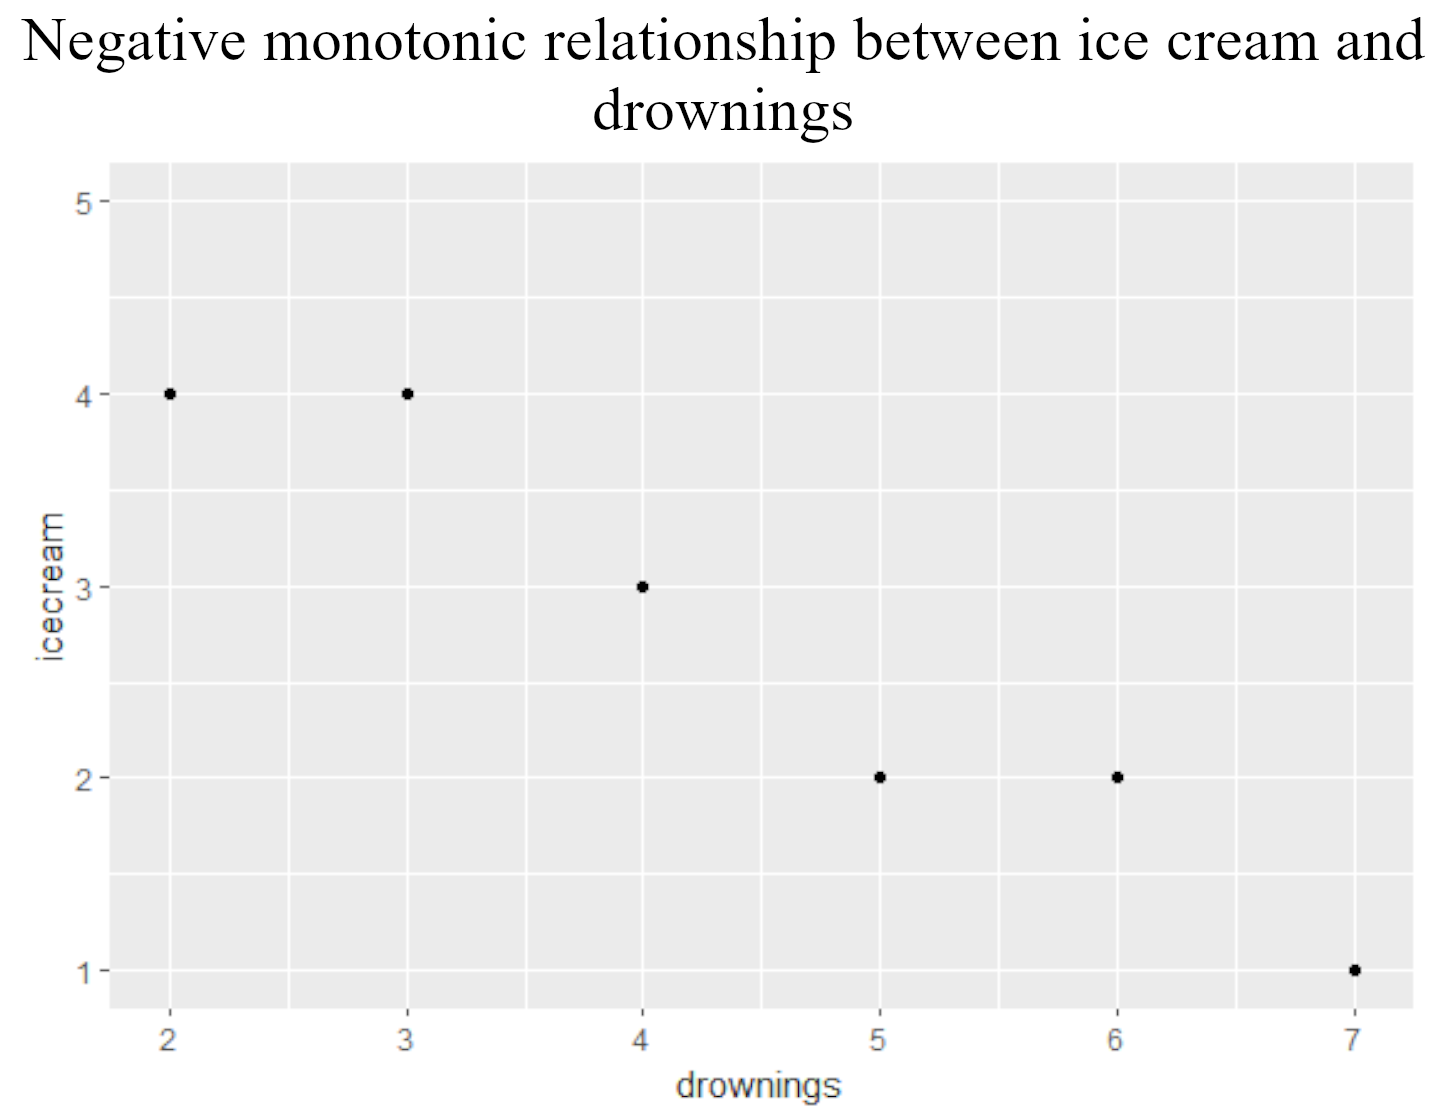
Monotonic relationships

  • Spearman correlation (rho) - monotonic relationship

    • Not consistently increasing or decreasing
  • Monotonic less restrictive than linear

ggplot(data, aes(x = drownings, 
                 y = icecream)) +
  geom_point()

A scatter plot showing a monotonically increasing relationship with ice cream stable, then increasing, then stable on the y-axis as drownings increase on the x-axis.

A scatter plot showing a monotonically decreasing relationship with ice cream stable, then decreasing, then stable, then decreasing on the y-axis as drownings increase on the x-axis.

A/B Testing in R

Hypothesis and sample size

  • Null hypothesis - no monotonic association between time and enjoyment of pizza
library(pwr)
pwr.r.test(r = 0.3, power = 0.80, 
           sig.level = 0.05)
    approximate correlation power 
 calculation (arctangh transformation) 

              n = 84.07364
              r = 0.3
      sig.level = 0.05
          power = 0.8
    alternative = two.sided
A/B Testing in R

Spearman ignoring groups

cor.test(~ enjoyment + time, 
         data = pizza, 
         method = "spearman", 
        exact = FALSE)
    Spearman's rank correlation rho
data:  time and enjoyment
S = 2, p-value = .003245
alternative hypothesis: true rho is 
not equal to 0
sample estimates:
      rho 
0.9984962 
samp <- length(pizza$time)
[1]  90
A/B Testing in R

Spearman within groups

cor.test(~ enjoyment + time, 
         data = pizza, 
         subset = 
             (Topping == "Cheese"),
         method = "spearman",
         exact = FALSE)
    Spearman's rank correlation rho
data:  time and enjoyment
S = 1.2434e-14, p-value = 0.0003968
alternative hypothesis: true rho is 
not equal to 0
sample estimates:
rho 
  1 
ggplot(pizza, aes(x = enjoyment, 
                  y = time, 
                  color = Topping)) + 
  geom_point()

A steep positive slope of Cheese data in blue at the left of the x-axis and less steep positive slope of Pepperoni data in pink on the right of the x-axis.

A/B Testing in R

Spearman power analysis

library(pwr)
pwr.r.test(r = 0.998, n = 90, 
           sig.level = 0.003)
     approximate correlation power 
  calculation (arctangh transformation) 

              n = 90
              r = 0.998
      sig.level = 0.003
          power = 1
    alternative = two.sided
A/B Testing in R

Referring to the output

rhotest <- cor.test(~ enjoyment + time, 
         data = pizza, 
         method = "spearman")
samp <- length(pizza$time)
library(pwr)
pwr.r.test(r = rhotest$estimate, 
           sig.level = rhotest$p.value,
           n = samp)
     approximate correlation power 
  calculation (arctangh transformation) 

              n = 90
              r = 0.998
      sig.level = 0.003
          power = 1
    alternative = two.sided
A/B Testing in R

Let's practice!

A/B Testing in R

Preparing Video For Download...