Introduction to correlations
A/B Testing in R

Lauryn Burleigh
Data Scientist
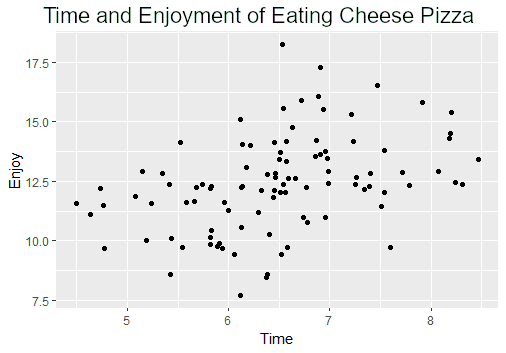
Correlation in A/B design
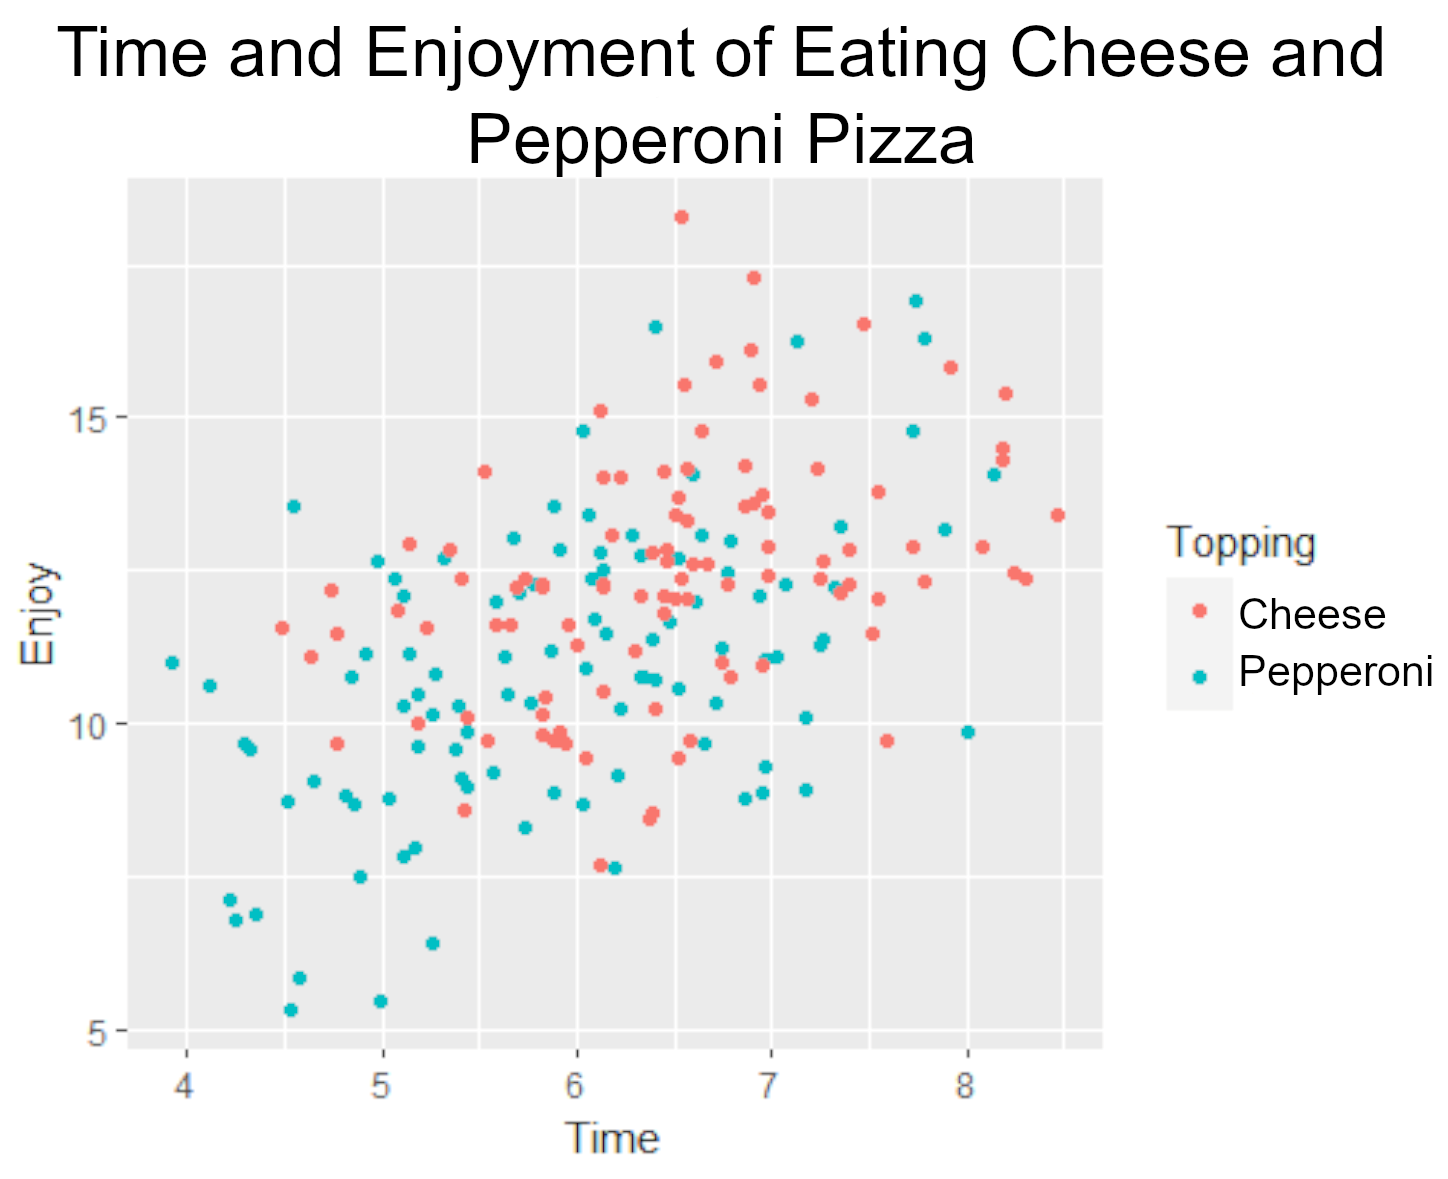
Correlation in A/B design
- Within groups

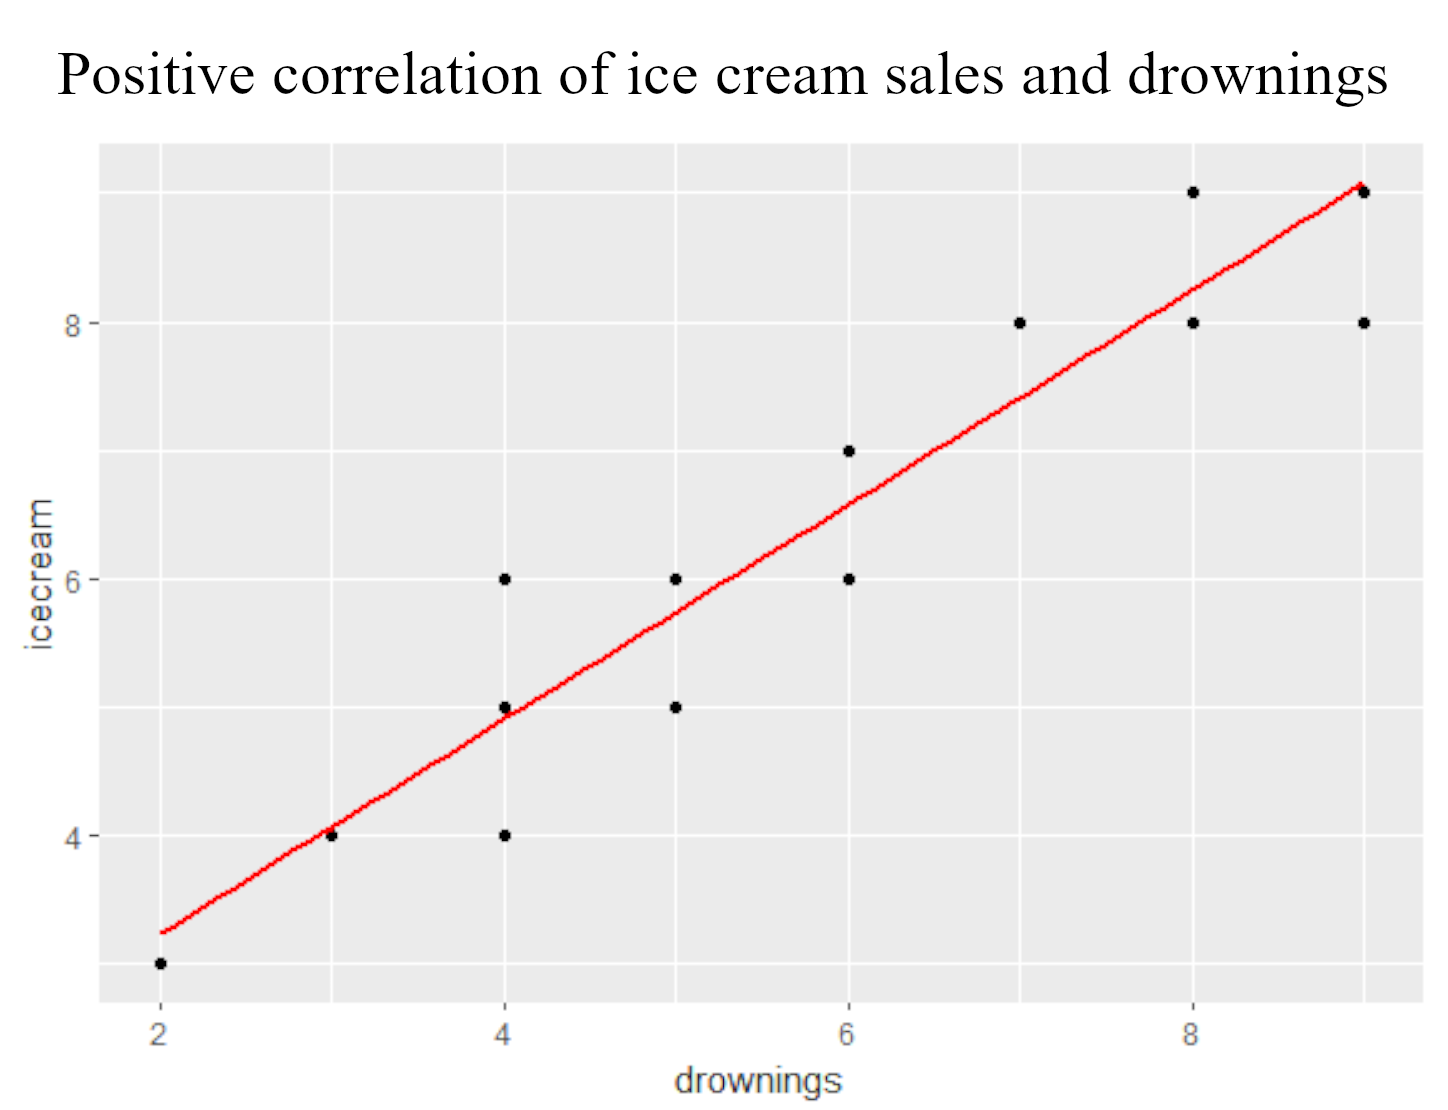
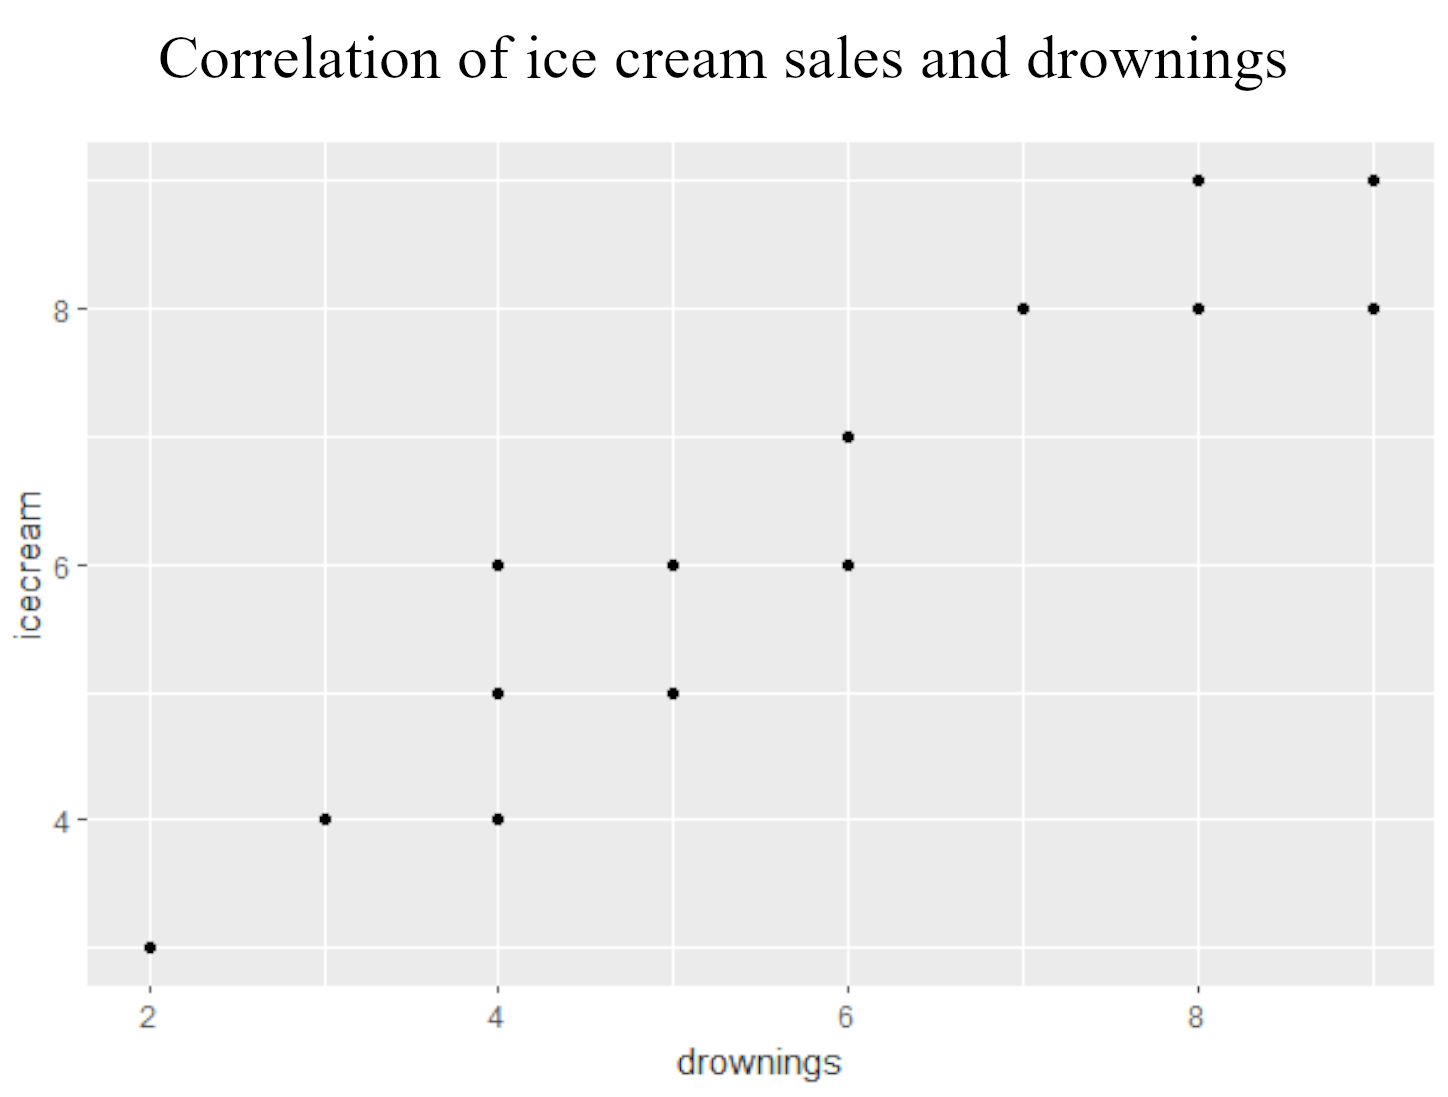
Correlation
ggplot(data, aes(x = drownings,
                 y = icecream)) +
  geom_point()
Correlation coefficient
- Correlation coefficient (r) - degree of association
- -1 to +1
- More extreme values - stronger association
- Better prediction
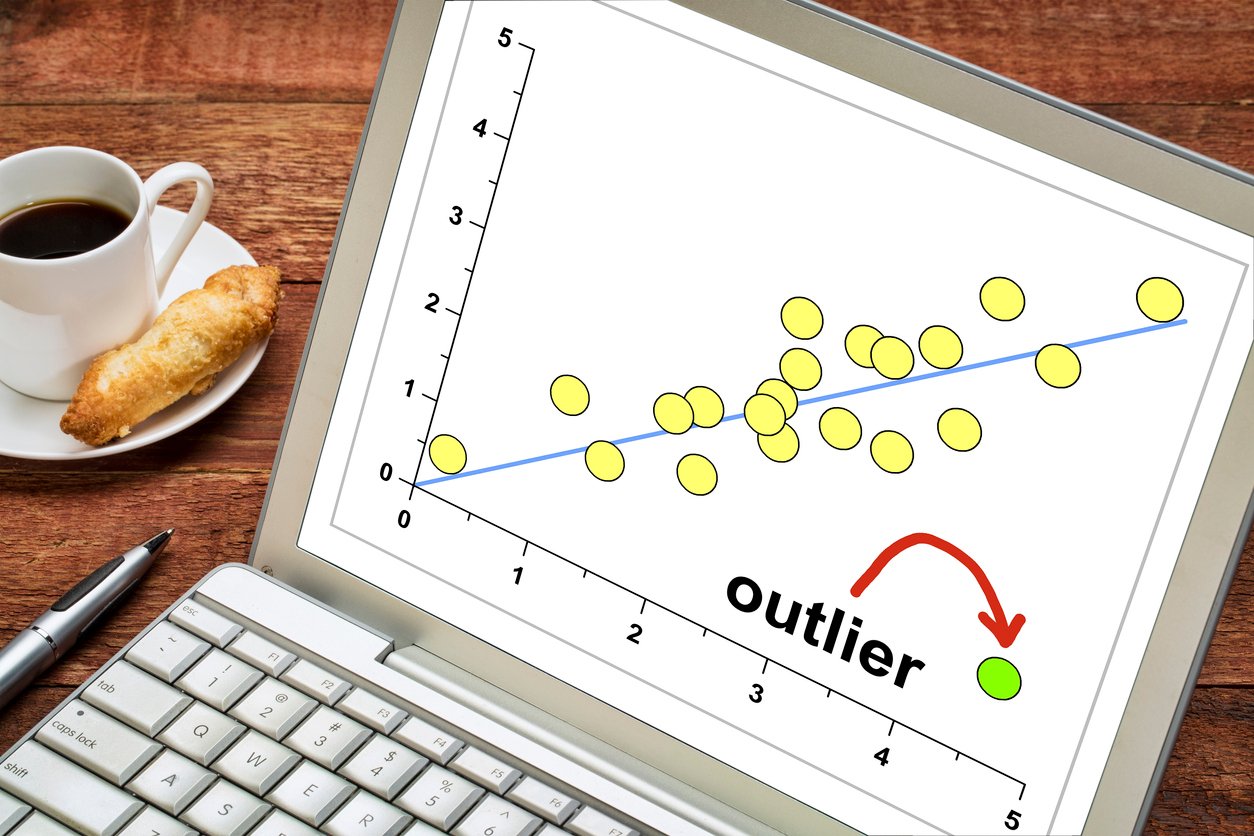
Correlation limitations