Independent-sample t-test
A/B Testing in R

Lauryn Burleigh
Data Scientist
Independent t-test in A/B design
- Significance in difference of means
- Null hypothesis:
- Cheese and Pepperoni pizza are eaten in the same amount of time (no difference)
Assumptions
- Dependent variable:
- Interval or ratio
- Equal intervals
- Random samples
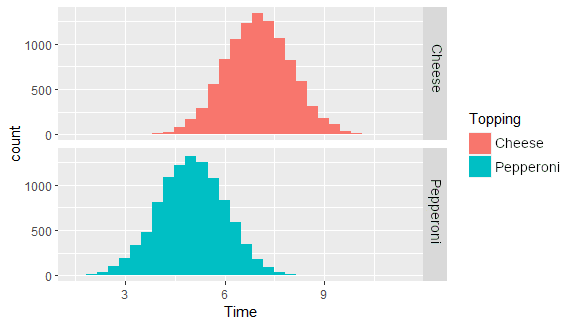
- Normal distribution
- Similar group variances
library(ggplot2)
ggplot(pizza, aes(x = Time,
                  fill = Topping)) +
       geom_histogram() +
       facet_grid(Topping~.)

Sample size
library(pwr)
pwr.t.test(d = 0.73, power = 0.80,
           sig.level = 0.05,
           type = "two.sample",
           alternative = "two.sided")
  Two-sample t test power calculation

              n = 30.44799
              d = 0.73
      sig.level = 0.05
          power = 0.8
    alternative = two.sided

NOTE: n is number in *each* group
Assessing variances
- Group variances equal
- Levene's test
Not significant (p > 0.05) = variances equal
If significant (p < 0.05) = variances not equal
library(car)
leveneTest(Time ~ Topping,
           data = Pizza)
Levene's Test for Homogeneity of Variance
         Df F value Pr(>F)
group   1  0.1457 0.7031
Test
t.test(Time ~ Topping, data = Pizza,
       paired = FALSE,
       alternative = "two.sided",
       var.equal = TRUE)
    Two Sample t-test
data:  Time by Topping
t = 2.3811, df = 198, p-value = 0.01821
alternative hypothesis: true difference
in means between group Pepperoni and
group Cheese is not equal to 0
95 percent confidence interval:
 0.0599370 0.6377601
Cohen's d
- Cohen's d: t-test effect size
- Standardized measure of differences between means
- Small: 0.2
- Medium: 0.5
- Large: 0.8
library(effectsize)
cohens_d(Time ~ Topping, data = Pizza)
Cohen's d |       95% CI
<----------------------
0.34      | [0.06, 0.62]
Power
library(pwr)

pwr.t.test(n = 1000,
           sig.level = 0.0182,
           d = 0.34,
           type = "two.sample")
  Two-sample t test power calculation
              n = 100
              d = 0.34
      sig.level = 0.0182
          power = 0.510256
    alternative = two.sided
NOTE: n is number in *each* group
- Ideal power to accept results: 0.8
- Probability of error: 20%
- 100 - 80 = 20
Let's practice!
A/B Testing in R

