Introduction to linear regression
A/B Testing in R

Lauryn Burleigh
Data Scientist
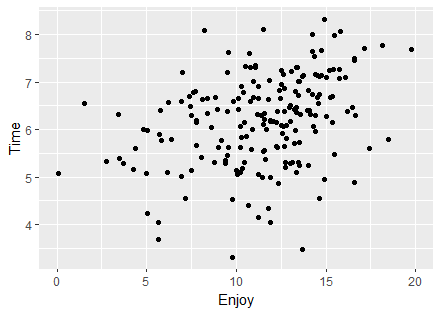
Regression
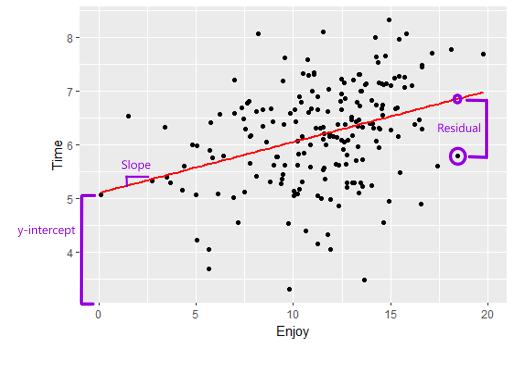
Regression line
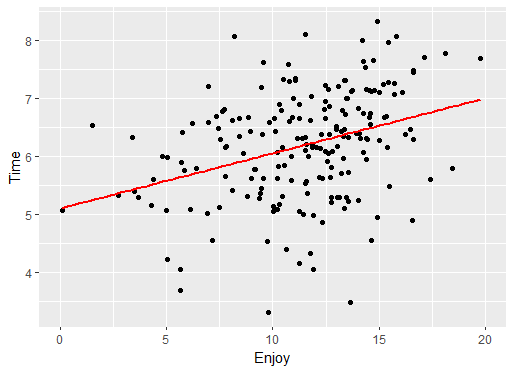
Regression line
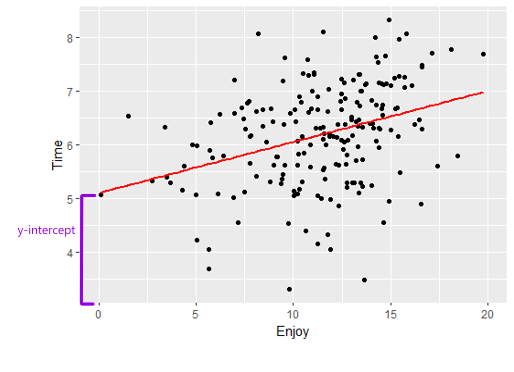
Regression line
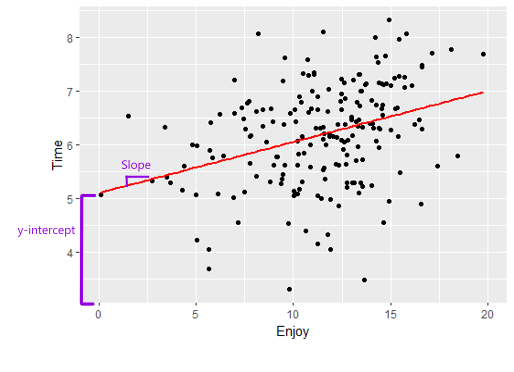
Regression line
Predicting data
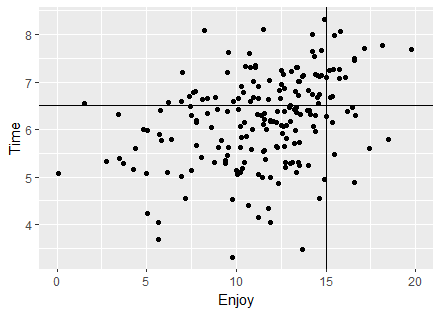
Regression considerations

A/B Testing in R
Lauryn Burleigh
Data Scientist

