Considerations in A/B testing

A/B Testing in R

Lauryn Burleigh

Data Scientist

A/B testing considerations

Only use A/B if...

  • Subjects/traffic are meaningful
  • Time available for design and tests
  • Clear hypothesis

A/B test considerations

  • Data fluctuations
  • Number of variables
  • Regression to the mean
A/B Testing in R

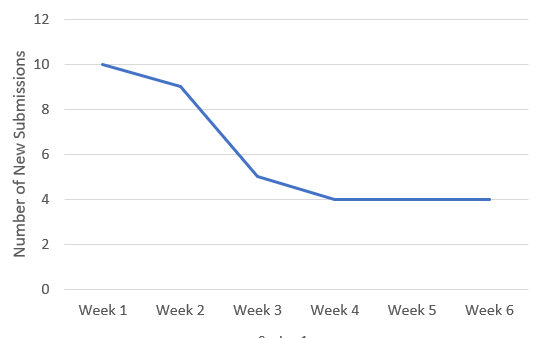
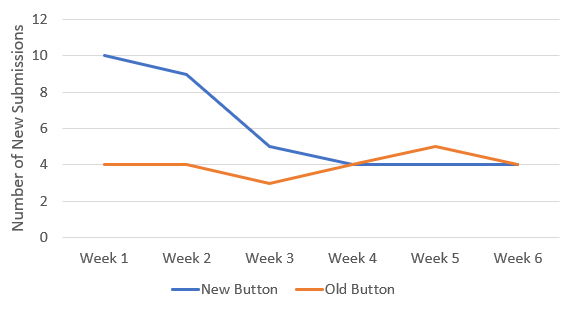
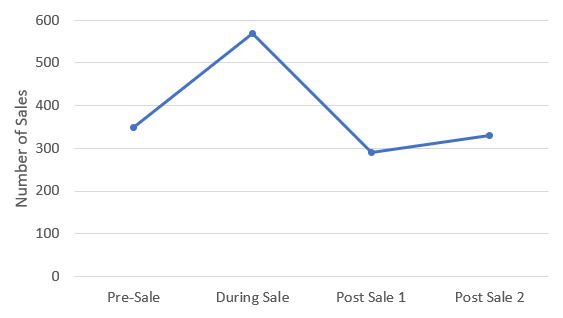
Fluctuations in data

  • For accuracy, need a representation of whole population
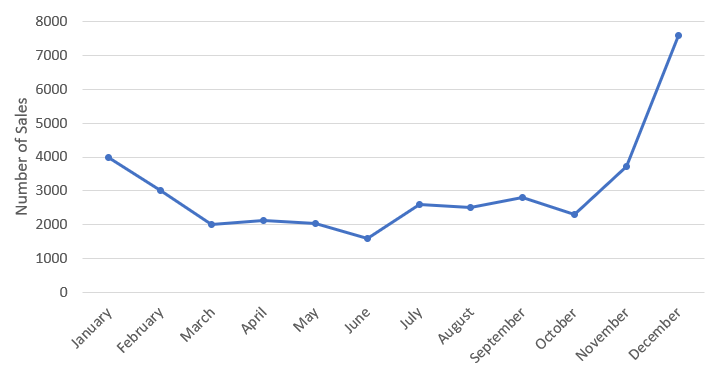
  • Fluctuations impact results
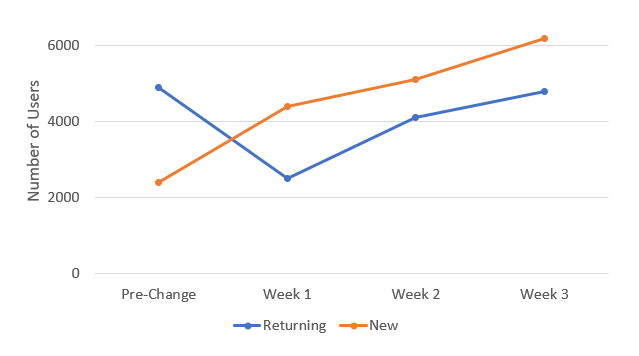
    • Change in subjects
    • Day of week
    • Holidays
    • Public regard

Line plot showing returning users initially declining then returning and new users increasing.

Number of sales increase during winter holidays.

Number of sales increases during a sale but decreases outside of the sale.

A/B Testing in R

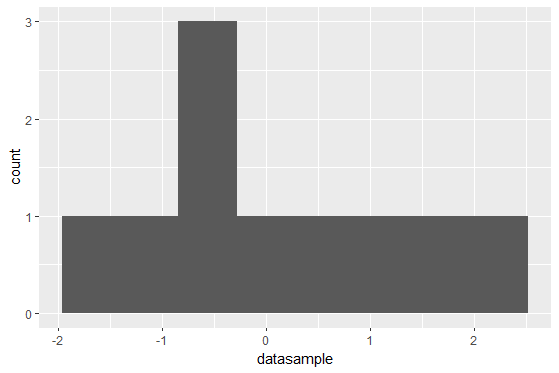
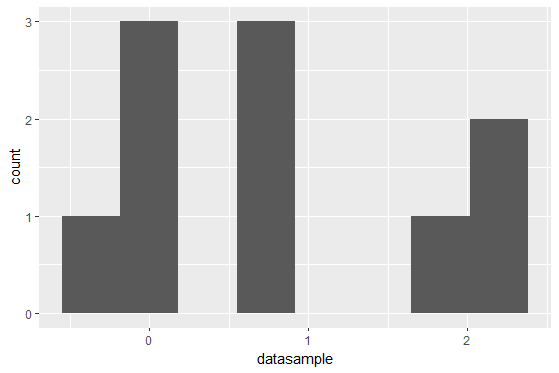
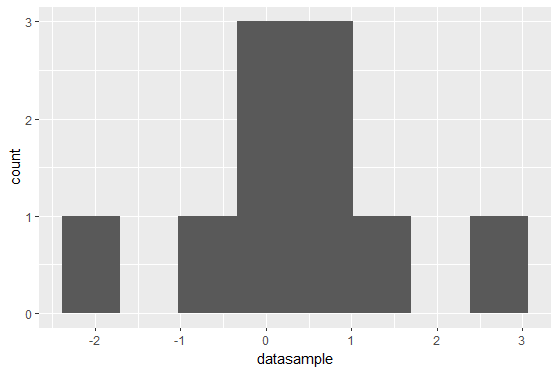
Example of fluctuations

normaldist <- rnorm(10000) 
datasample <- sample(normaldist, 10)
ggplot() + 
    aes(datasample) +
    geom_histogram(bins = 8)
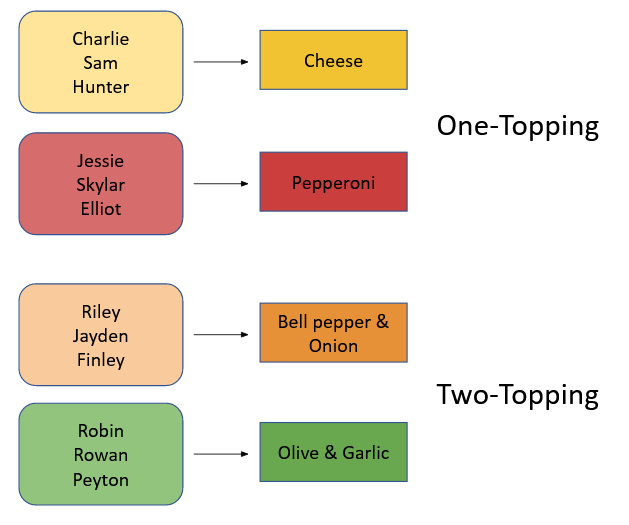
A histogram of 10 data points with data points across the whole x-axis.

A histogram of 10 data points with bars at the beginning middle and end of the x-axis.

A histogram of 10 data points with bars mostly in the middle of the x-axis.

A/B Testing in R

Number of variables

  • One variable - ideal
  • One topping/one variable
    • Assessing individual topping/condition
    • Cheese: control variable
    • Pepperoni: topping variable
  • Two topping/multiple variables
    • Assessing combinations
    • Pairings: bell pepper & onions, olives & garlic
    • No control

Cheese and Pepperoni one topping pizzas with 3 subjects in each group and bell pepper with onion and olive with garlic two topping pizzas with 3 subjects in each.

A/B Testing in R

Variables and type I error

  • More variables -> more analyses
    • Greater Type I error rate
  • Common significance: 5%
    • alpha: 0.05
    • 5% chance of a Type I error
  • Confidence level: 100 - significance
    • Used to calculate family-wise error rate
      • 1 - Probability of no false positives

Calculate family-wise error rate

  • Significance: 5%
  • Confidence level: 95%
  • Tests to run: 10
1 - (1-0.05)^10

1 - (0.95)^10
0.40126306076

40%

A/B Testing in R

Regression to the mean

  • Extreme values averaging out with additional data
  • Type I error risk
  • Compare to a control group

A line plot showing many new submissions at first but regressing to the mean with more time.

A line plot showing no change in submissions for the original button as compared to the many new submissions with a change while the group with the change regresses to the mean meeting the no change data.

A/B Testing in R

Regression to the mean

  • Small sample sizes are inaccurate
  • Type I error risk
  • More data -> true mean
ID Enjoyment [1-10]
01 1
02 10
03 9
mean(c(1, 10))
5.5
mean(c(1, 10, 9))
6.6666
A/B Testing in R

Let's practice!

A/B Testing in R

Preparing Video For Download...