Linear regression
A/B Testing in R

Lauryn Burleigh
Data Scientist
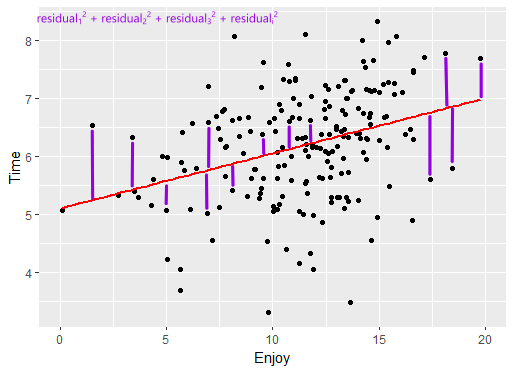
Least squares
Assessing assumptions
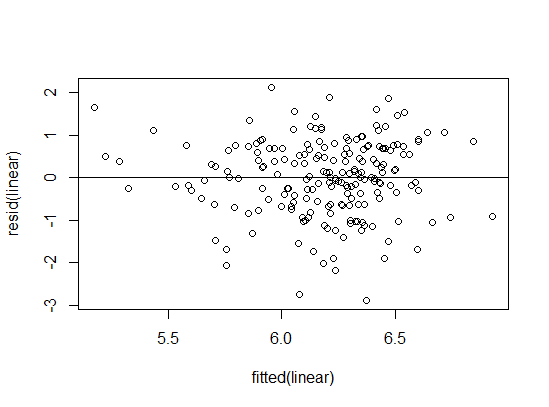
Homoscedasticity
- Consistent variance
plot(fitted(linear), resid(linear));
abline(0,0)
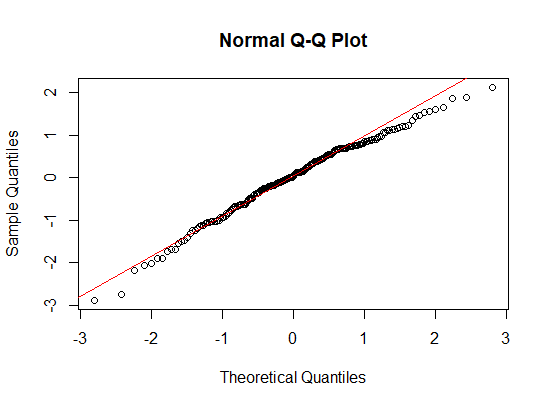
Normality
qqnorm(resid(linear));
qqline(resid(linear), col = "red")