Power and sample size
A/B Testing in R

Lauryn Burleigh
Data Scientist
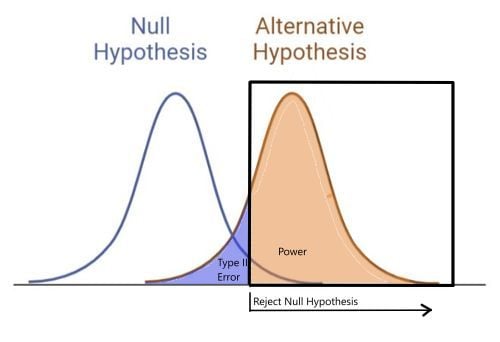
Power defined
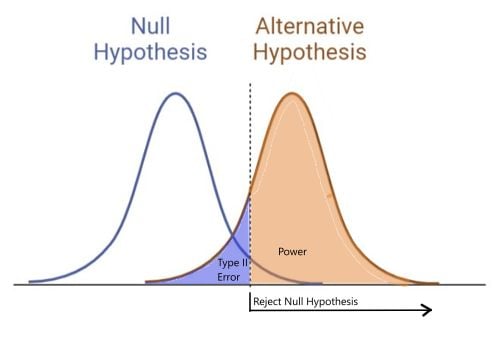
Power benefits
Test usefulness
- Rejecting null hypothesis when it should be
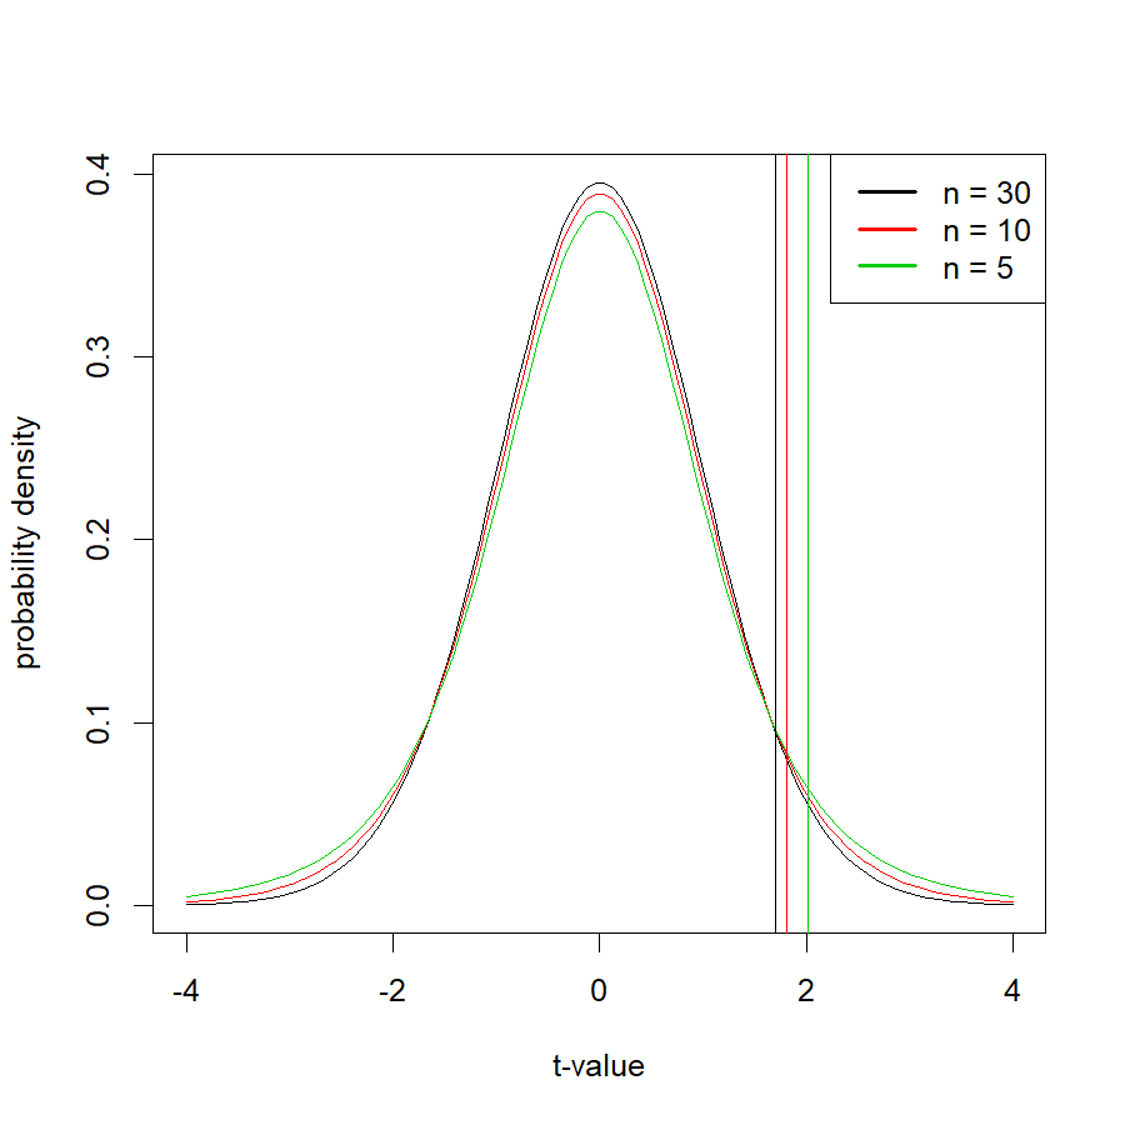
Sample size
- Estimated effect size
- Estimated power (commonly 0.8)
- Alpha (commonly 0.05)
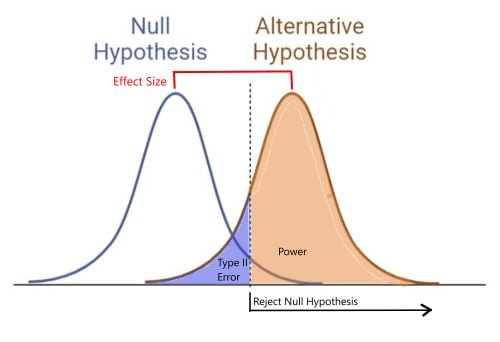
Effect size
- Expected size of effect
- Mean of control group - mean of experimental group
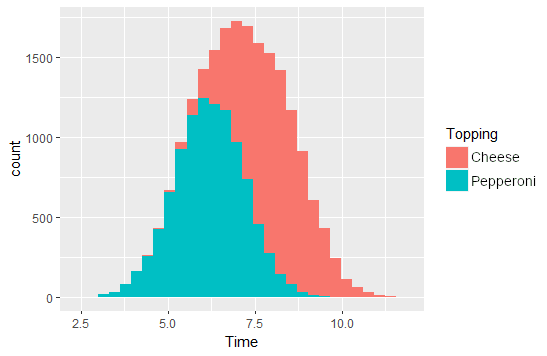
Pizza distributions
Similar distributions
No significant difference
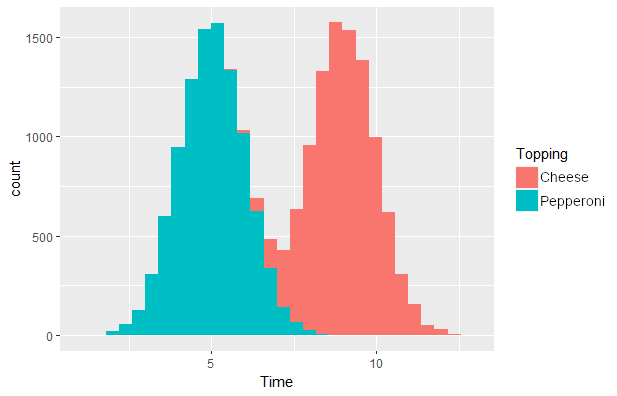
Different distributions
Likely significant difference
Pizza hypotheses
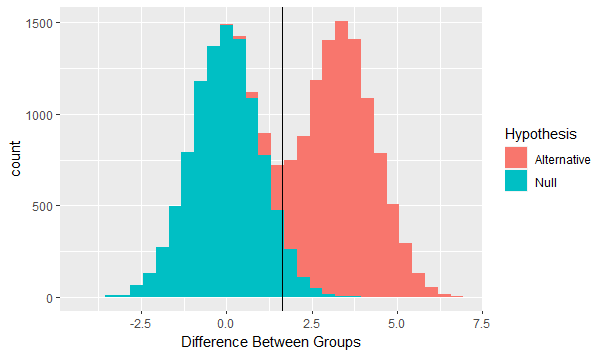
- Similar: left of rejection value
- Different: right of rejection value
Pizza power
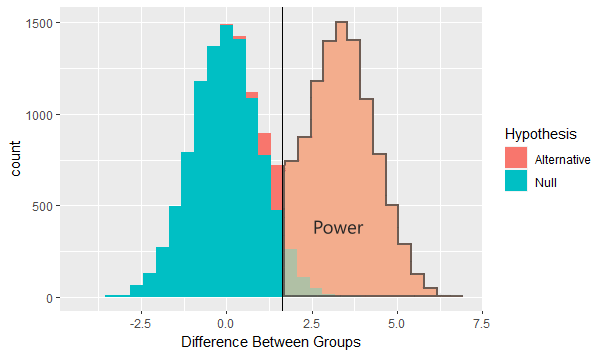
- Similar: left of rejection value
- Different: right of rejection value
- Power: probability of not incorrectly finding same topping distributions (Type II error)

