Reporting A/B test results
A/B Testing in R

Lauryn Burleigh
Data Scientist
A/B visualizations
- Send conclusions outside the data team
- Clear visualizations
- Accurately convey findings

Bar plots
- Hypothesis comparing group means
- t-test
Visualizes:
- Mean
- Error bars
- Standard deviation
- Standard error
- Confidence interval
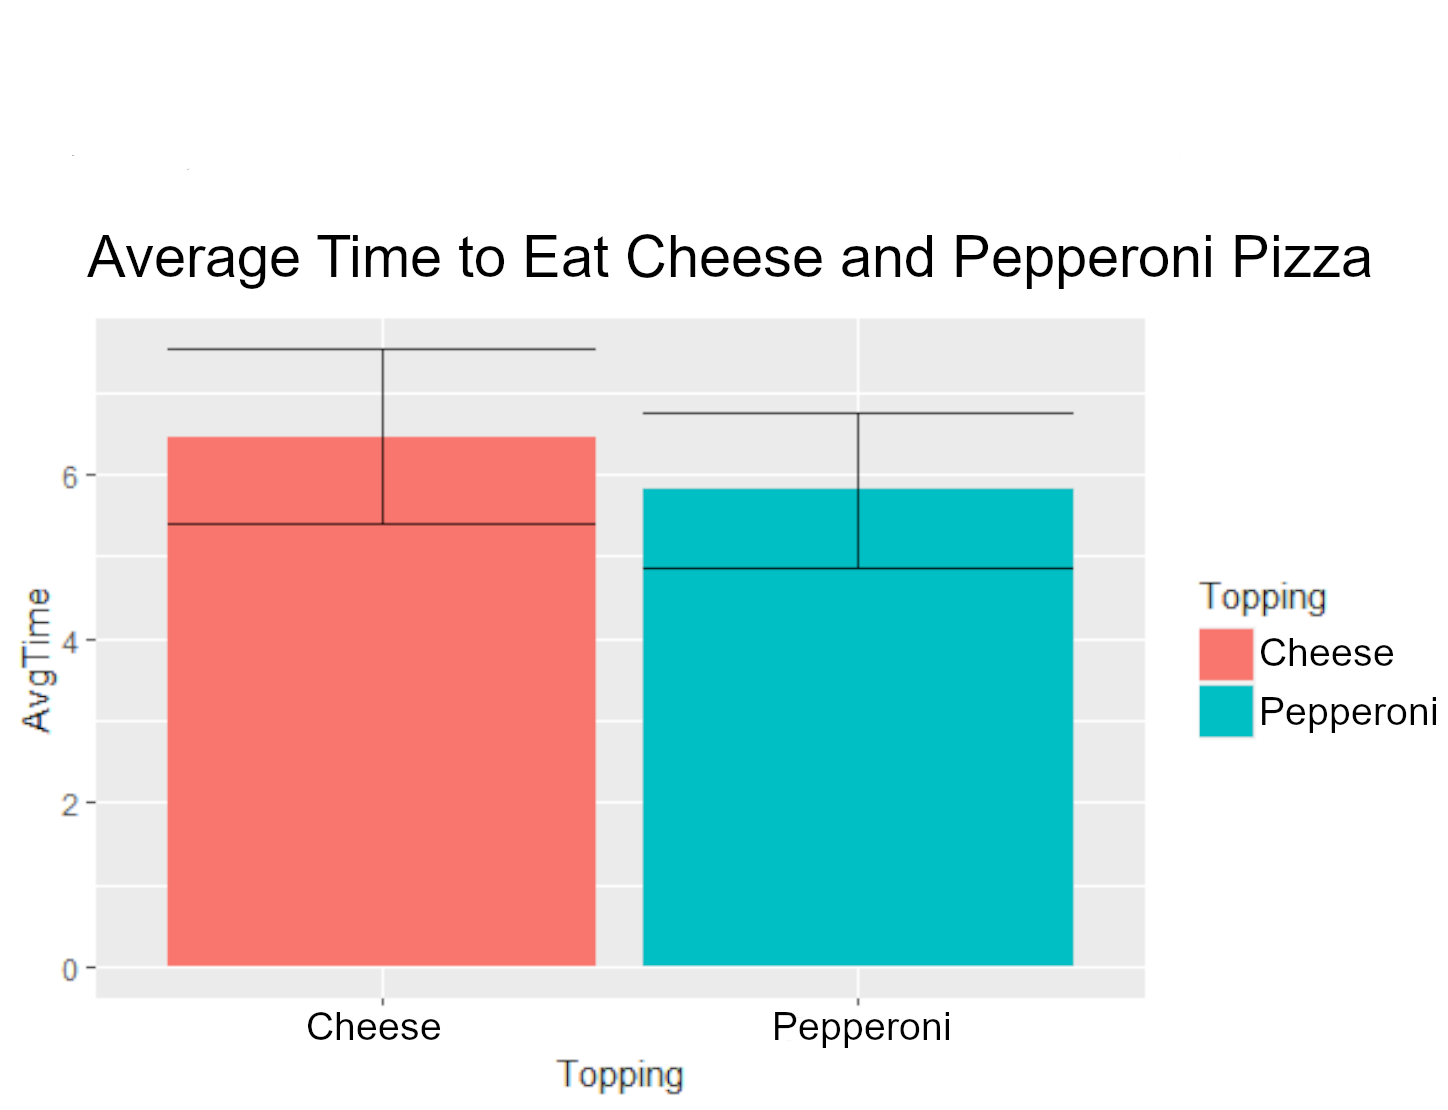
Bar data formatting
library(dplyr) data <- pizza %>% group_by(Topping) %>%summarise(AvgTime = mean(Time), SdTime = sd(Time))
data
# A tibble: 2 × 3
  Topping   AvgTime SdTime
  <chr>       <dbl>  <dbl>
1 Cheese      5.81  0.948
2 Pepperoni   6.46  1.06
Using bar plots
library(ggplot2)ggplot(data, aes(x = Topping,y = AvgTime,fill = Topping)) +geom_bar(stat = "summary", fun = "mean") +geom_errorbar(aes( ymin = AvgTime - SdTime, ymax = AvgTime + SdTime))

Box plots
- Comparing group medians
- Mann-Whitney U
- Chi-square
- Fisher's Exact
- t-tests
- Bottom box limit: 25% of data points below
- Top box limit: 75% of data points below
- Whiskers: highest and lowest values
- Outliers excluded
- Outliers: point outside of whiskers
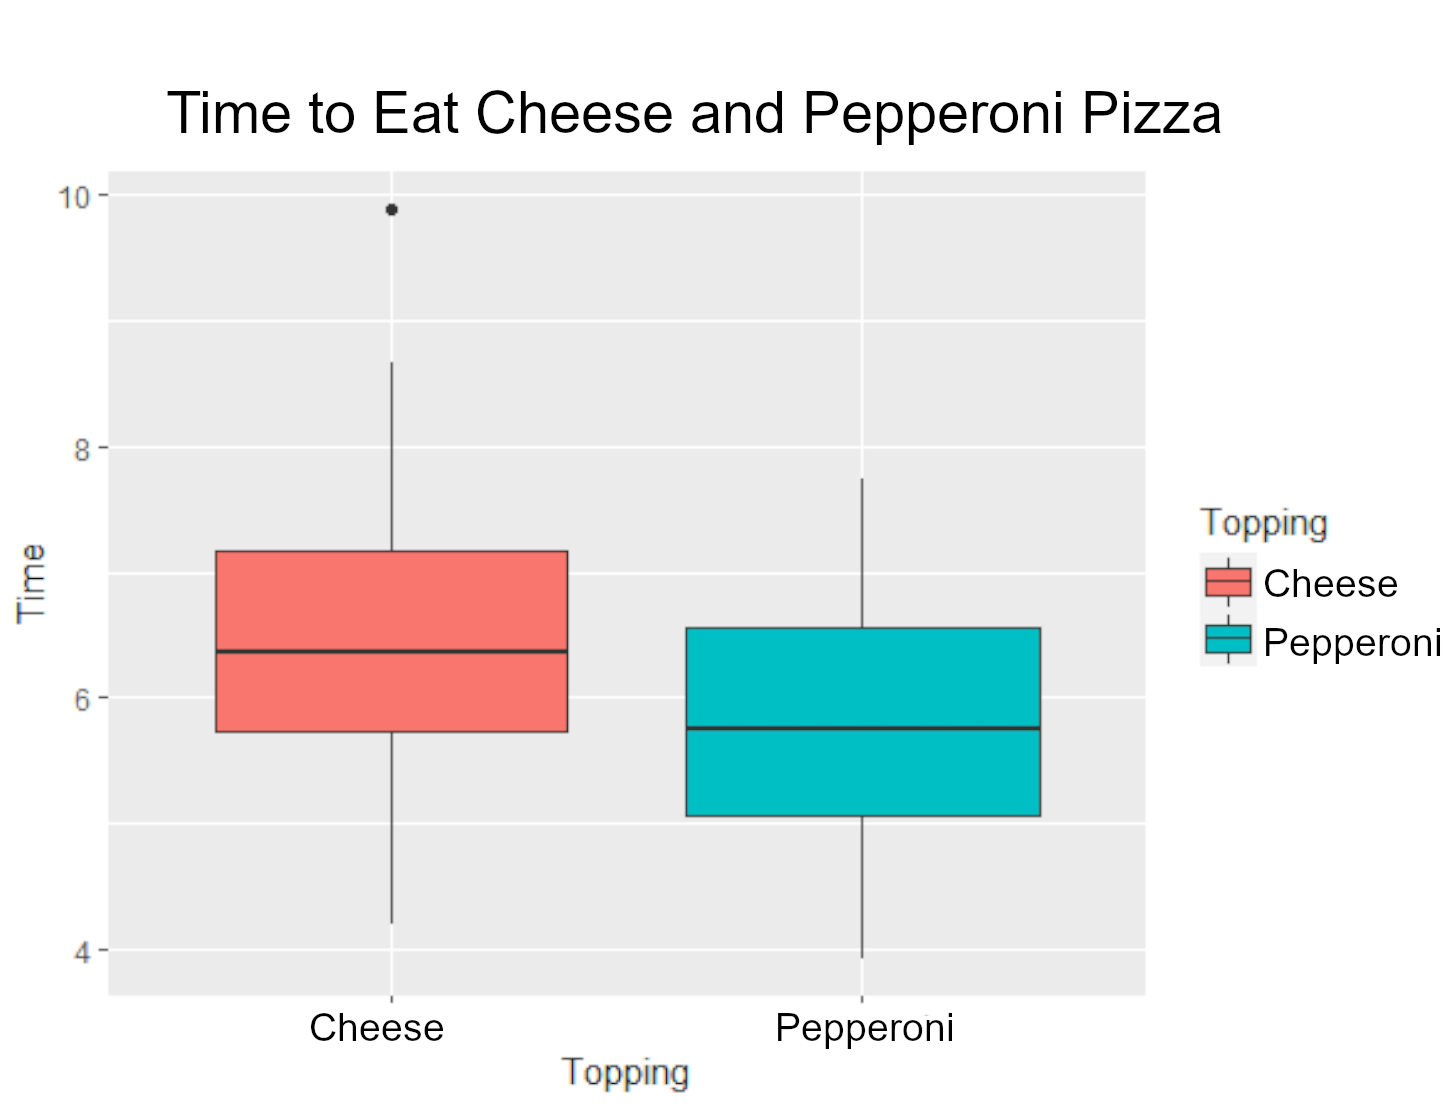
Using box plots
- Data in long format
- Ideal for researchers or statisticians or assessing non-normal distributions
ggplot(pizza, aes(x = Topping, y = Time, fill = Topping)) +geom_boxplot()

Scatter plots
- Relationship between variables
- Correlations
- Every point
- Trend: direction and rate
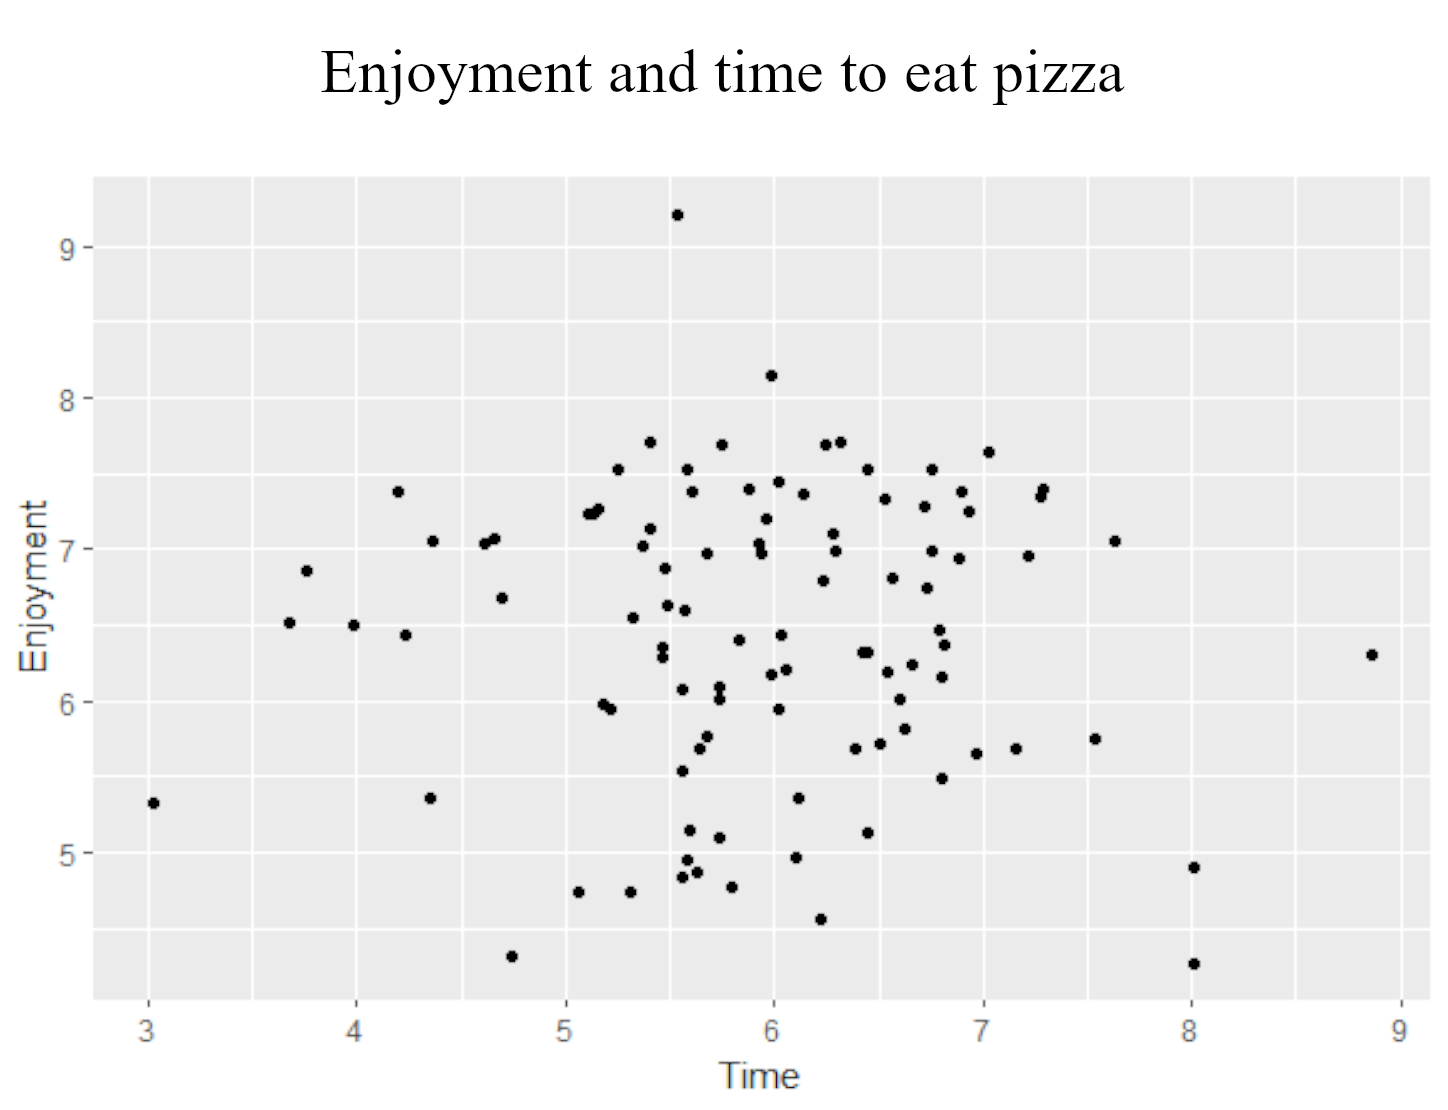
Using scatter plots
library(ggplot2) ggplot(pizza, aes(x = Time, y = Enjoyment, fill = Topping)) +geom_point()
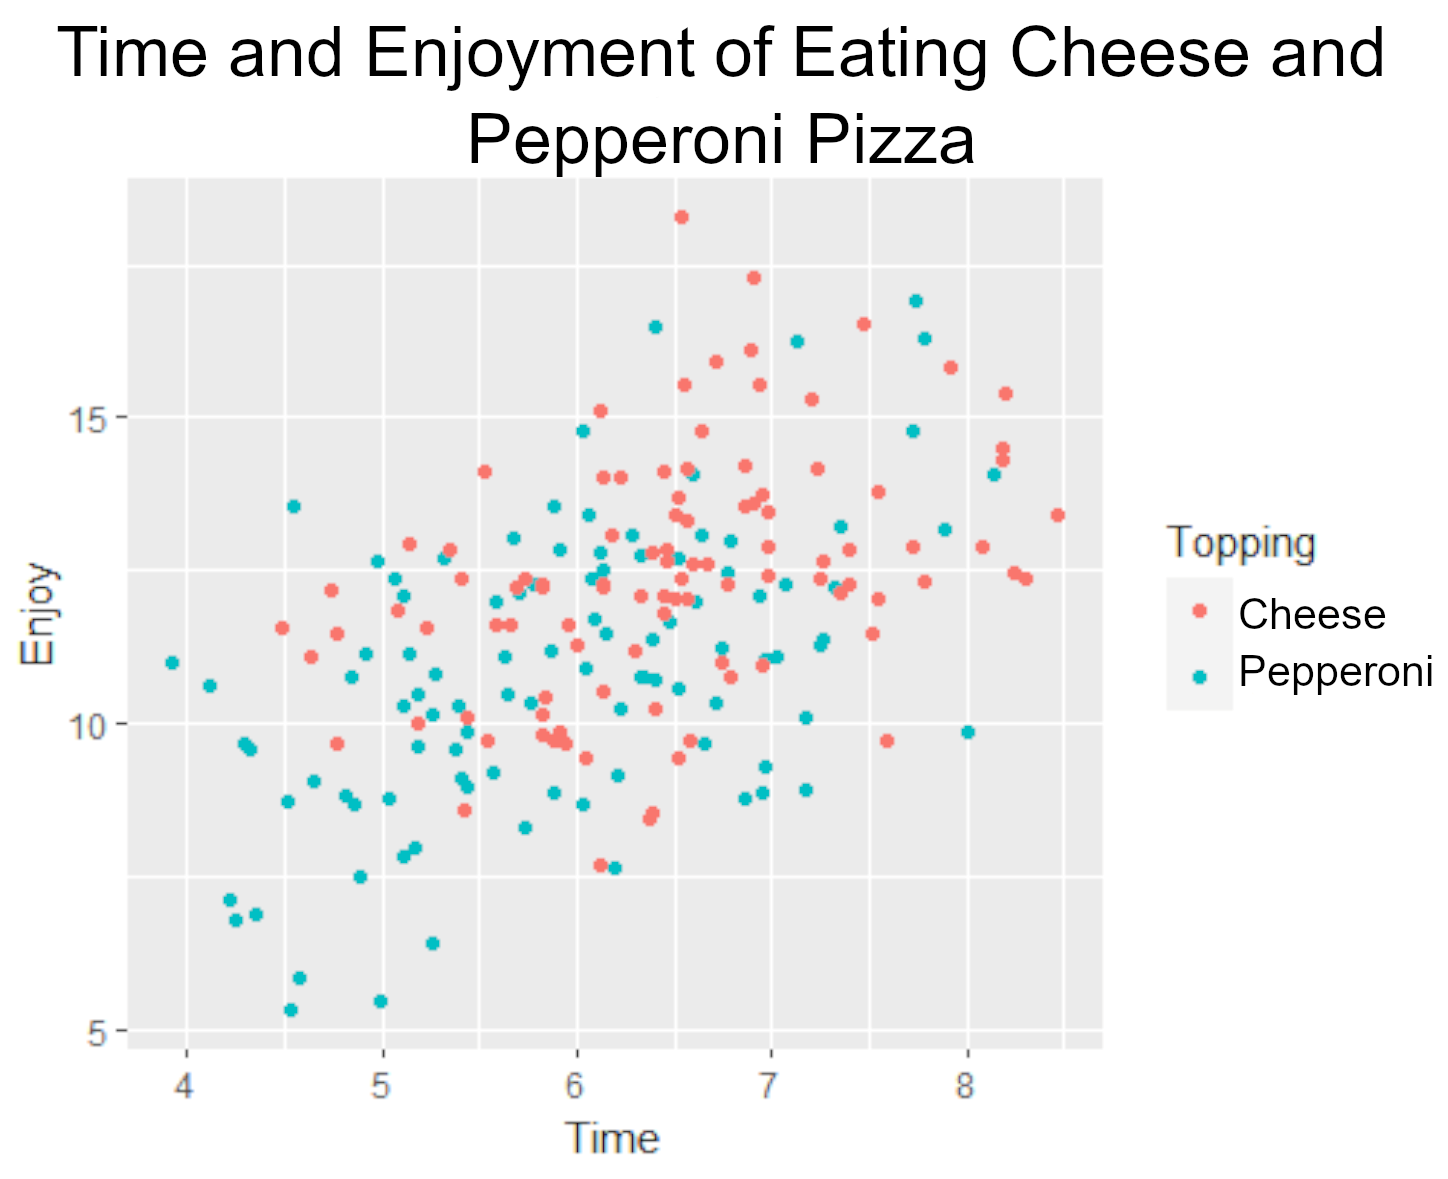
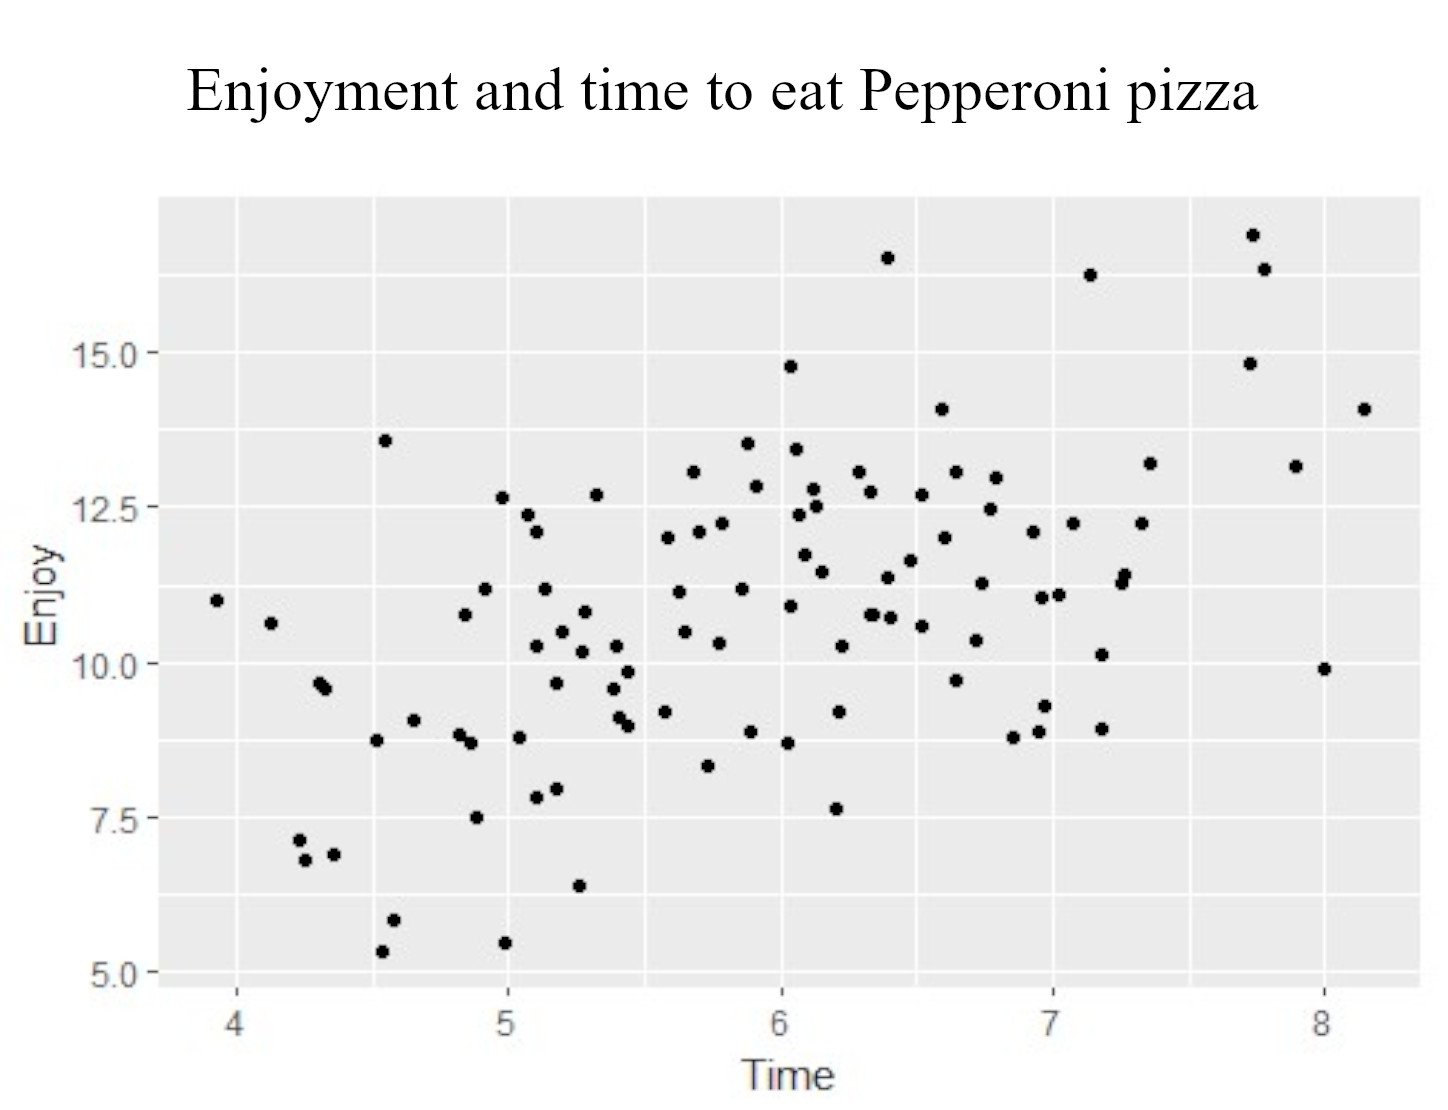
Using scatter plots
- Subset data to assess one group
ggplot(subset(pizza,
              Topping %in%
              "Pepperoni"),
       aes(x = Time, y = Enjoy)) +
  geom_point()
Presenting data
Audience has no statistics background:
- Statistic values uninformative
- Use real-world findings
- Test conclusion
- Power analysis
- Error bars

Presenting data example
Results:
- Significant t-test
- Power = 0.9
Presentation:
- Significant difference was found
- Pepperoni pizza was eaten quicker than Cheese
- Reliable results
- No large variation (error bars)

Let's practice!
A/B Testing in R

