Visualizing data
Introduction to Data Visualization with Julia

Gustavo Vieira Suñe
Data Analyst
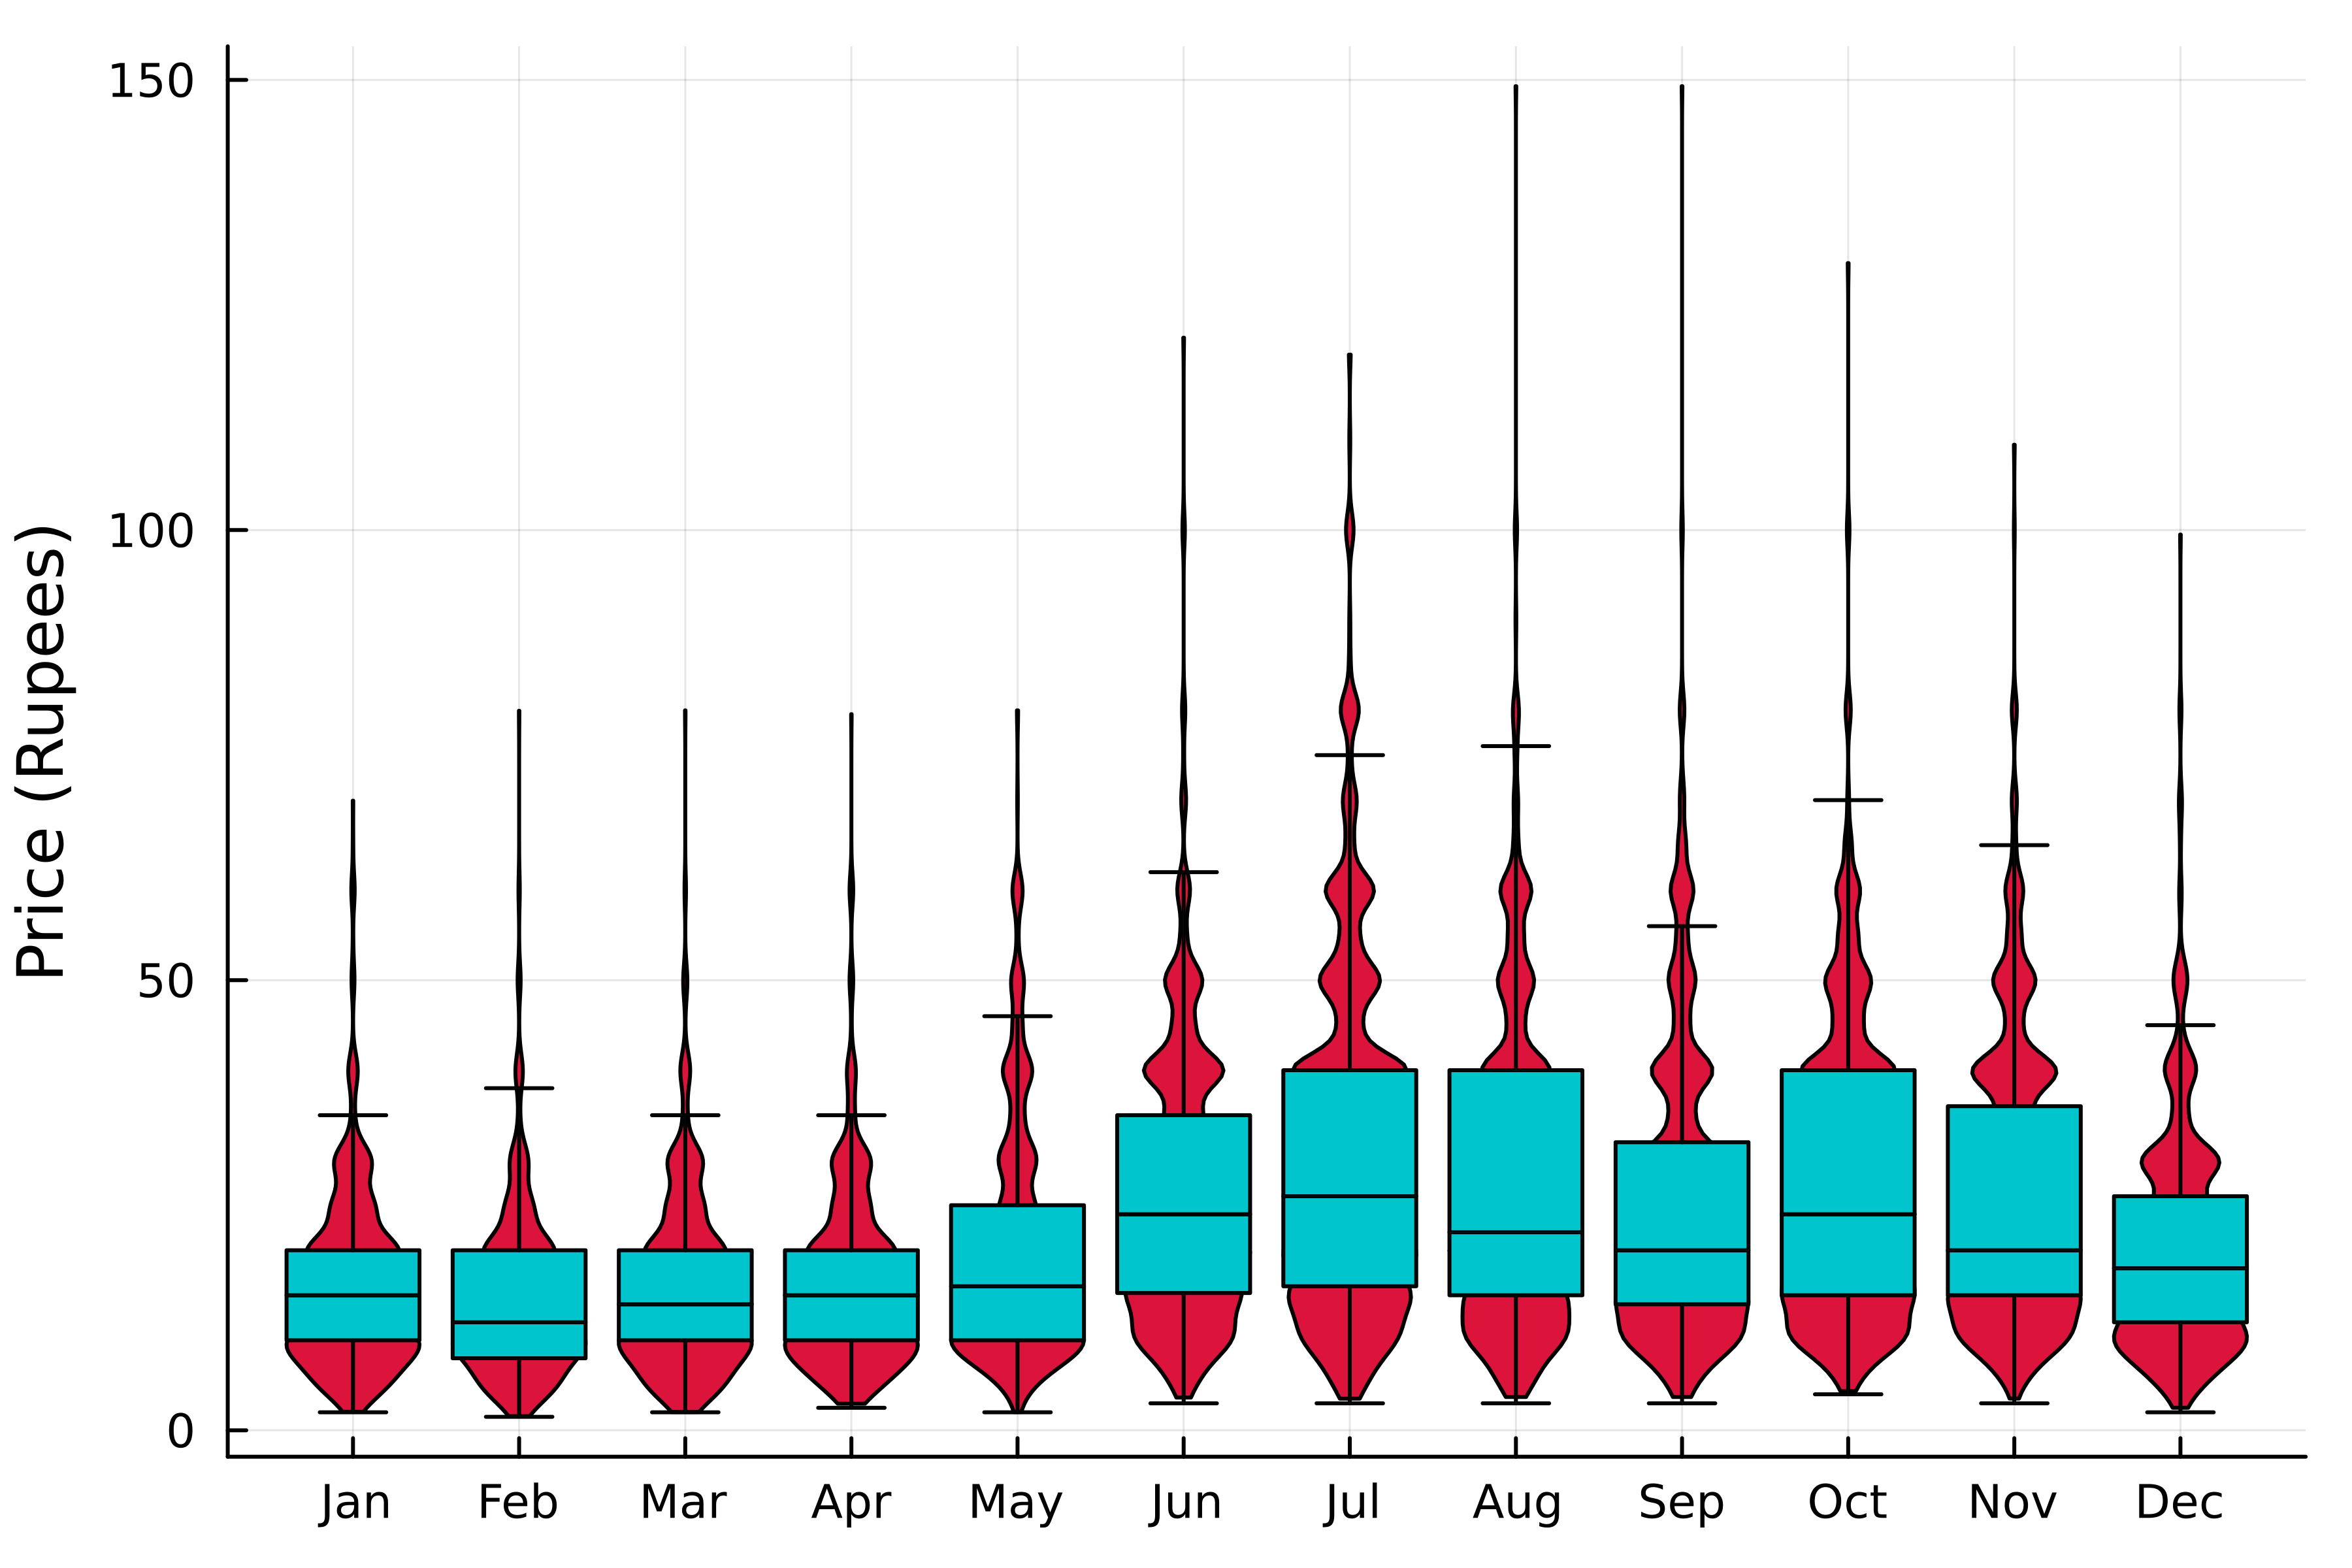
Why should I plot?
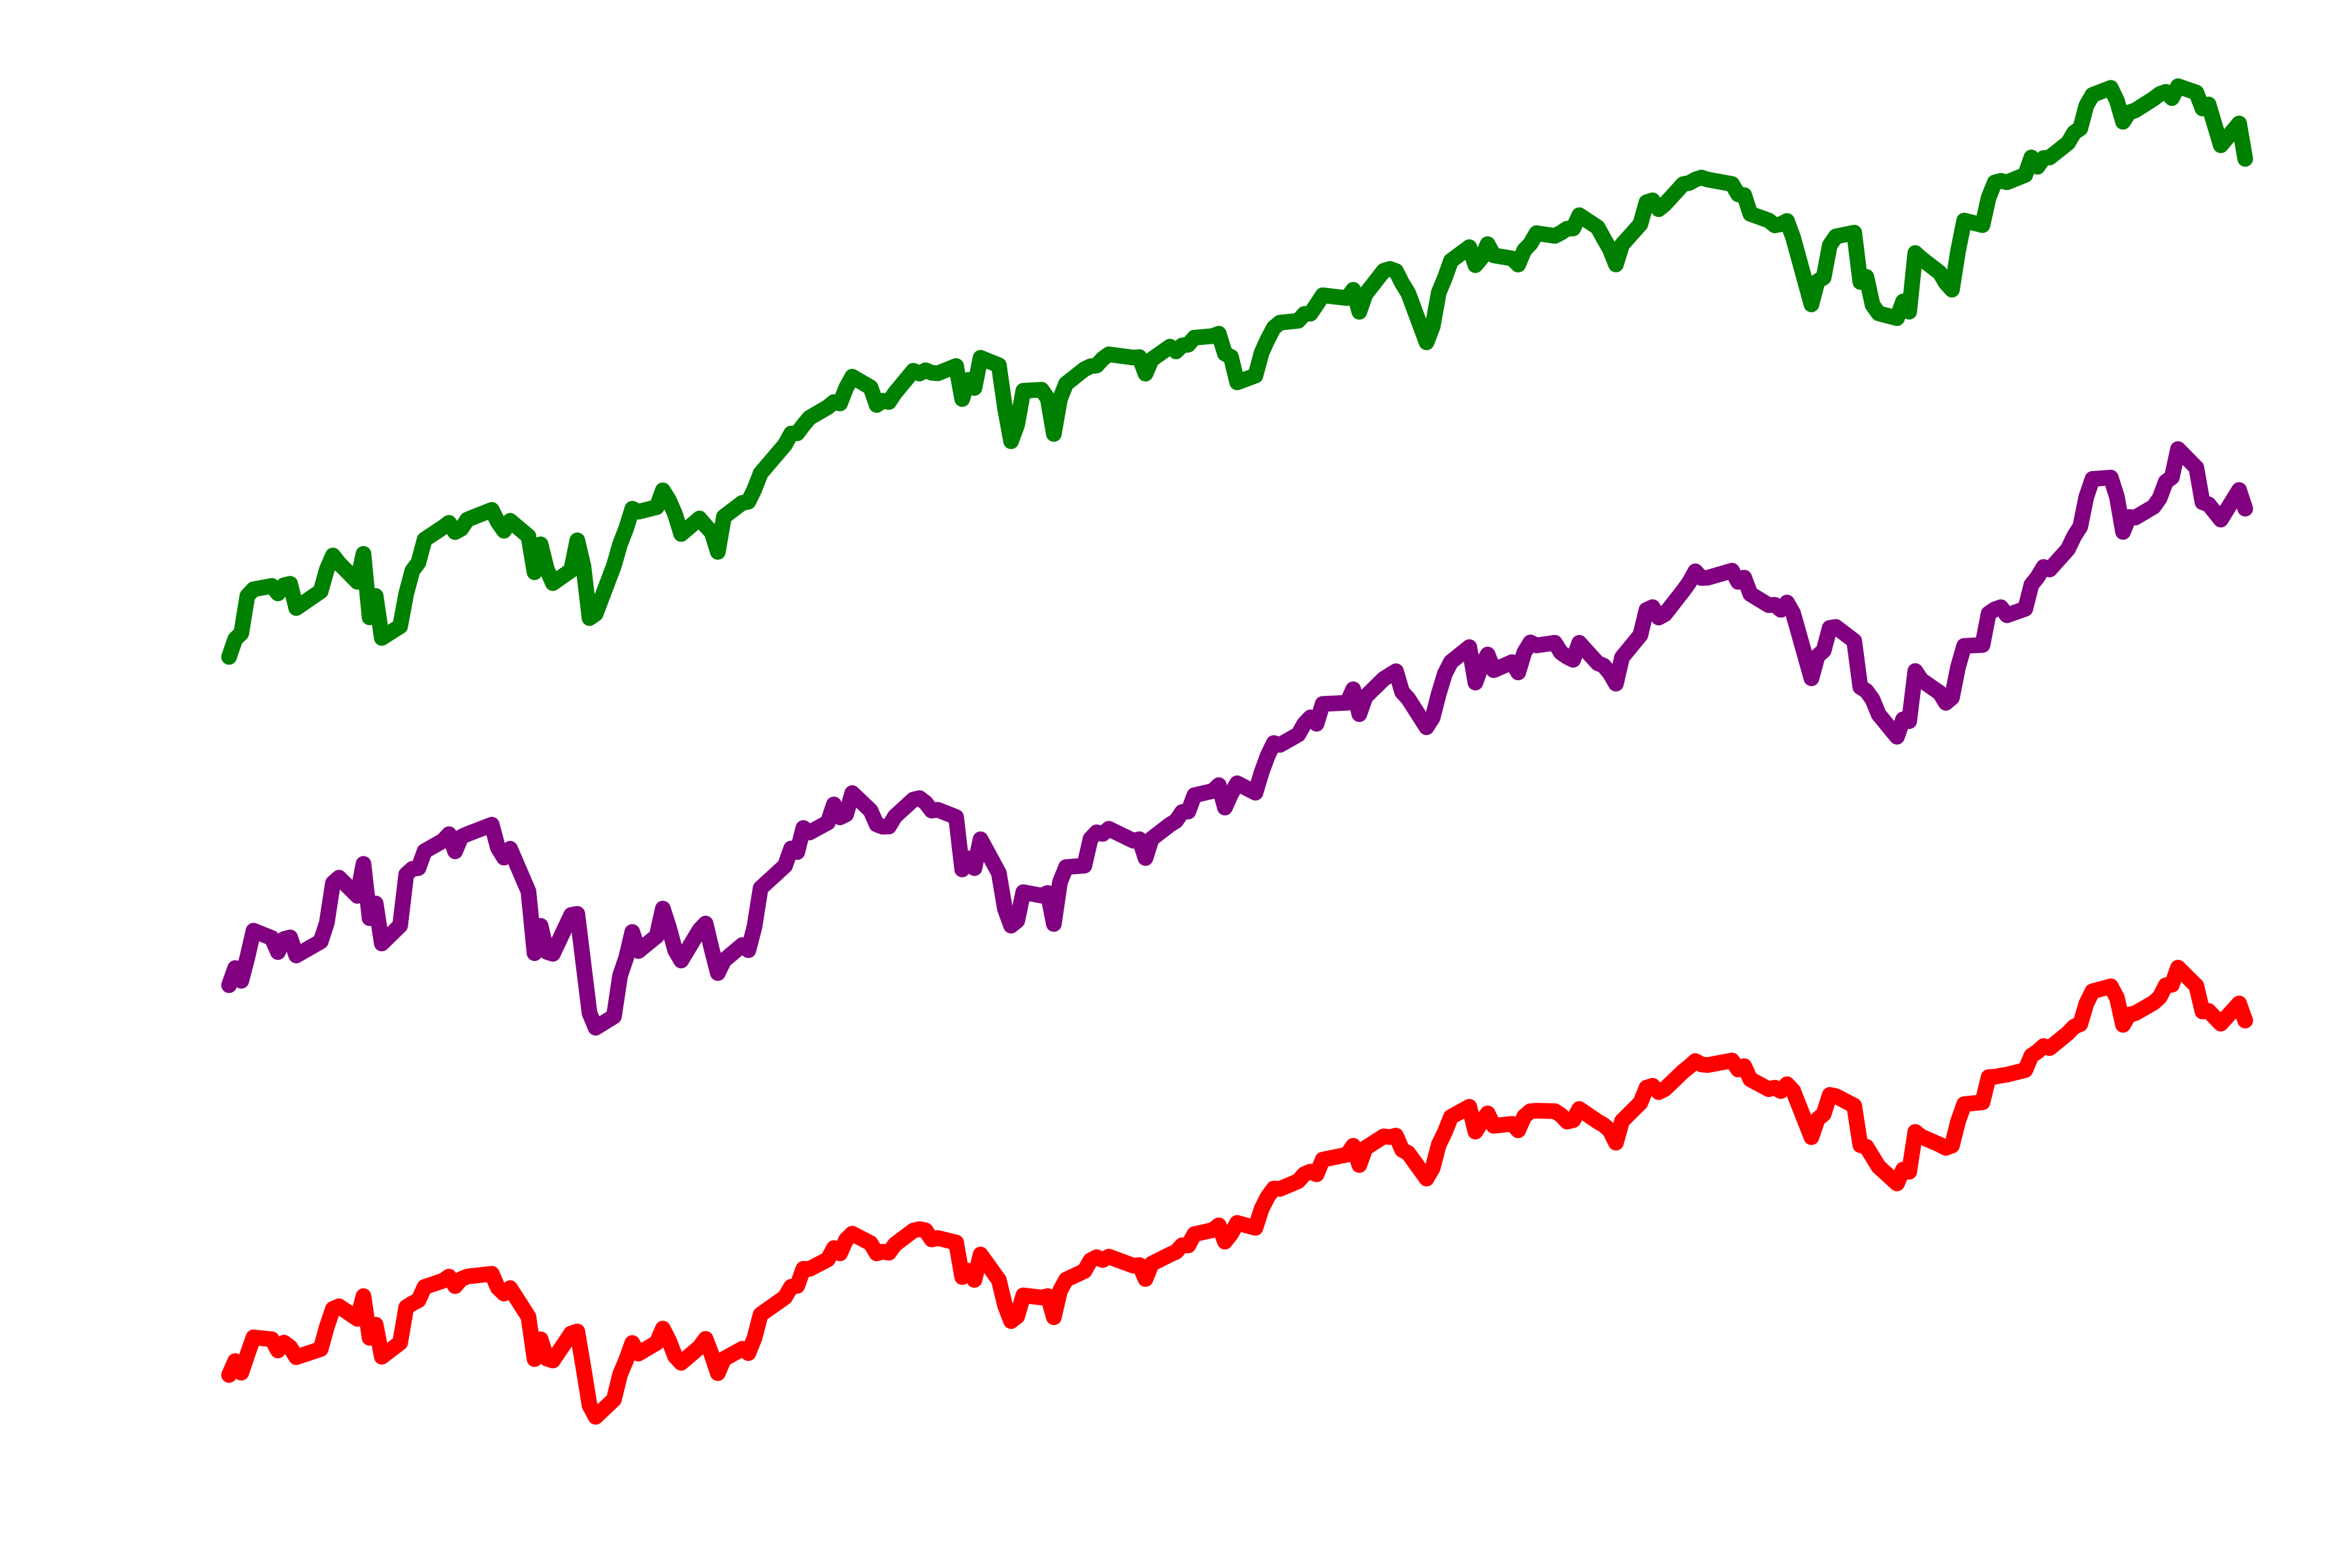
- Identify trends and patterns
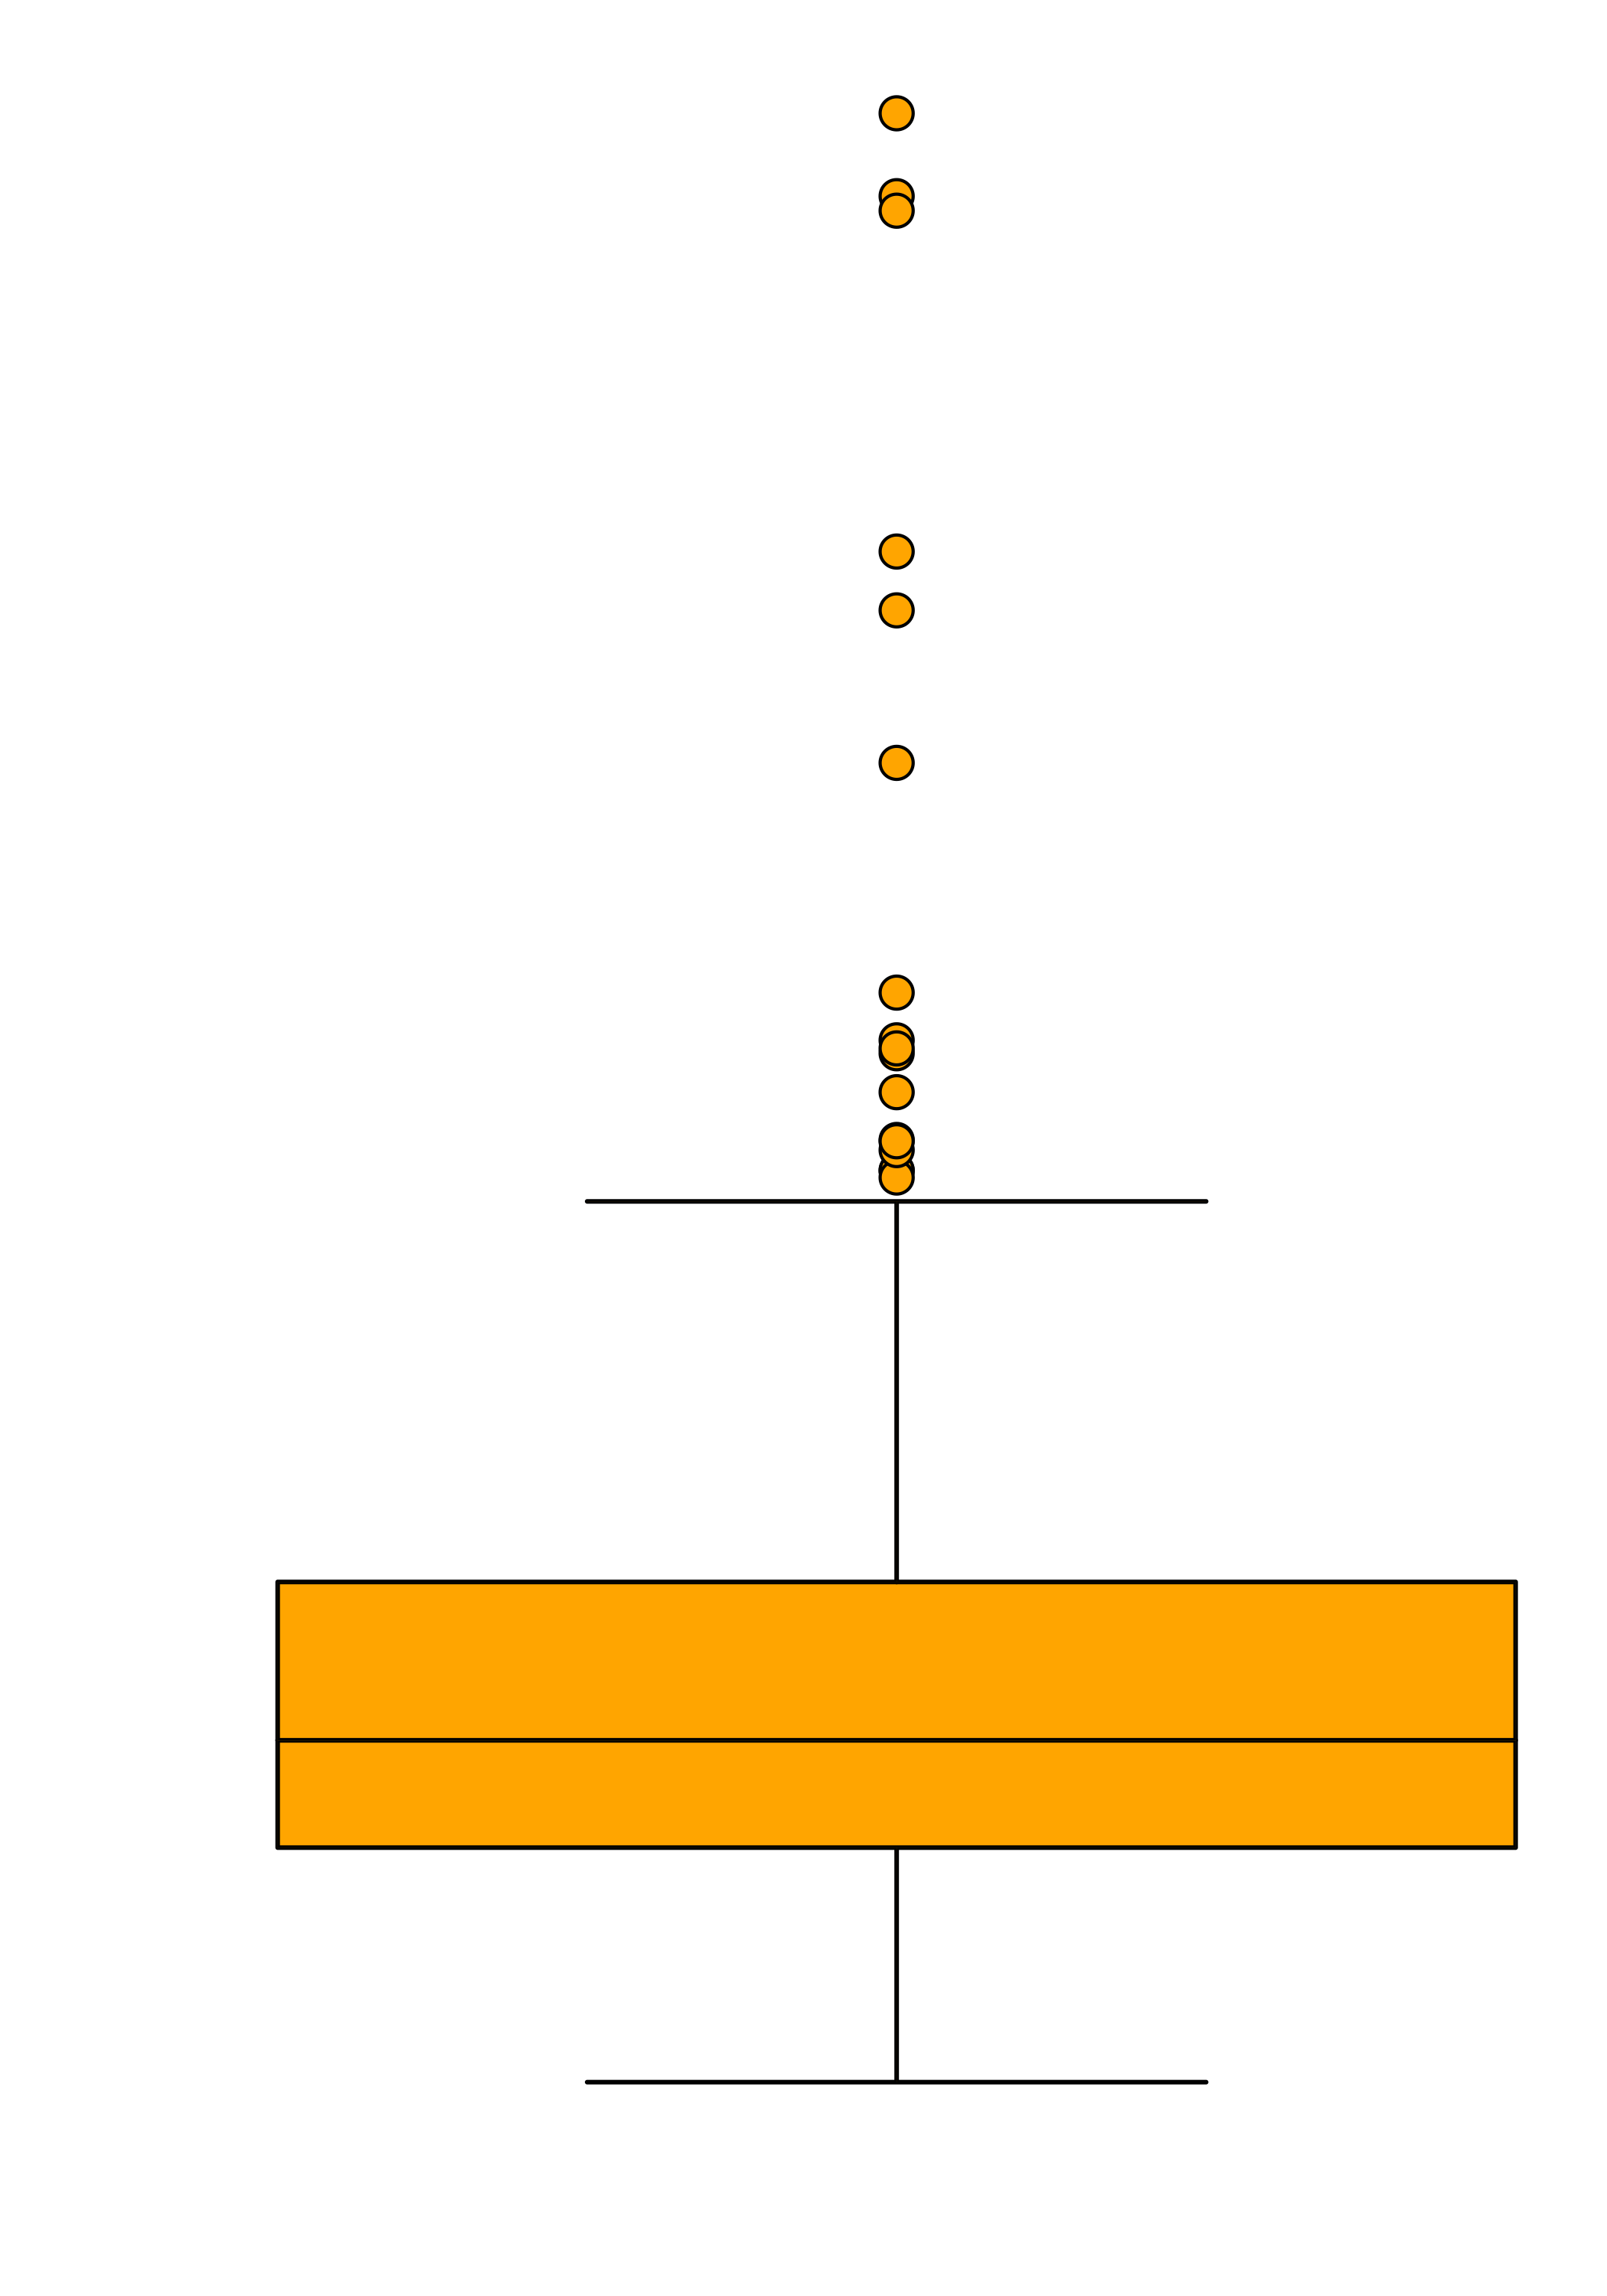
- Spot outliers
Why should I plot?
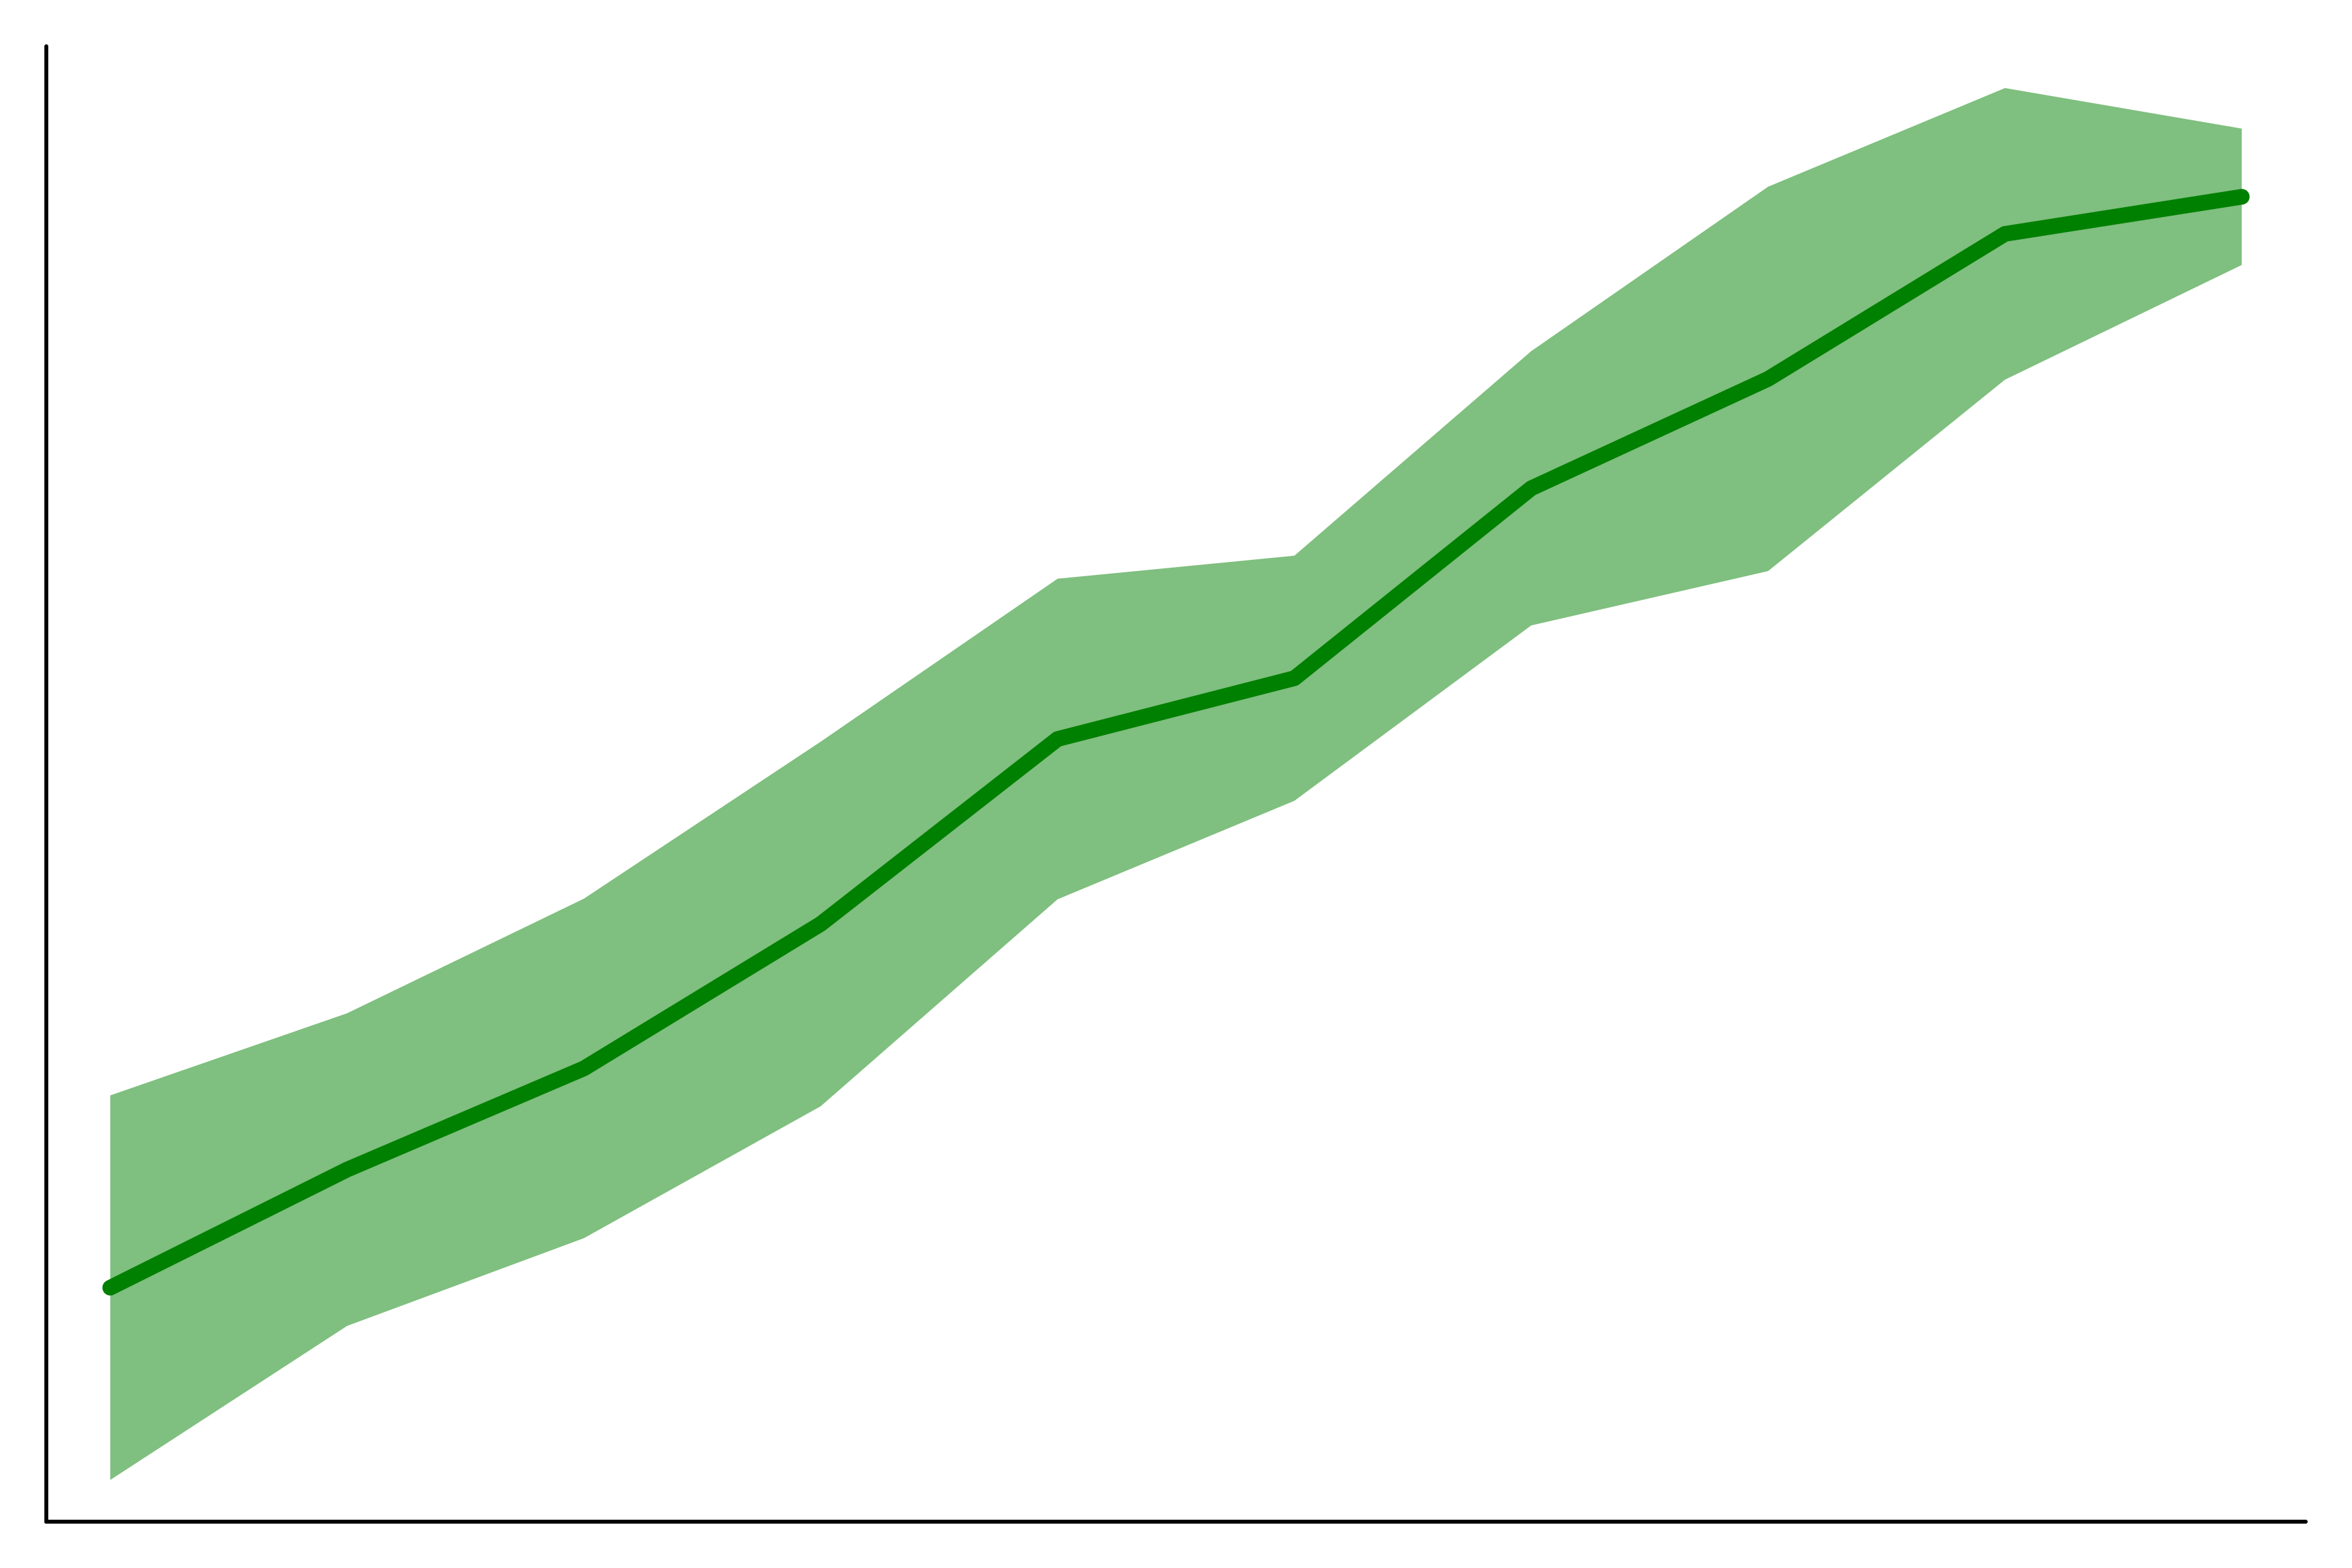
- Convey uncertainty
- Explore relationships

Table versus graph
- Much data requires plotting
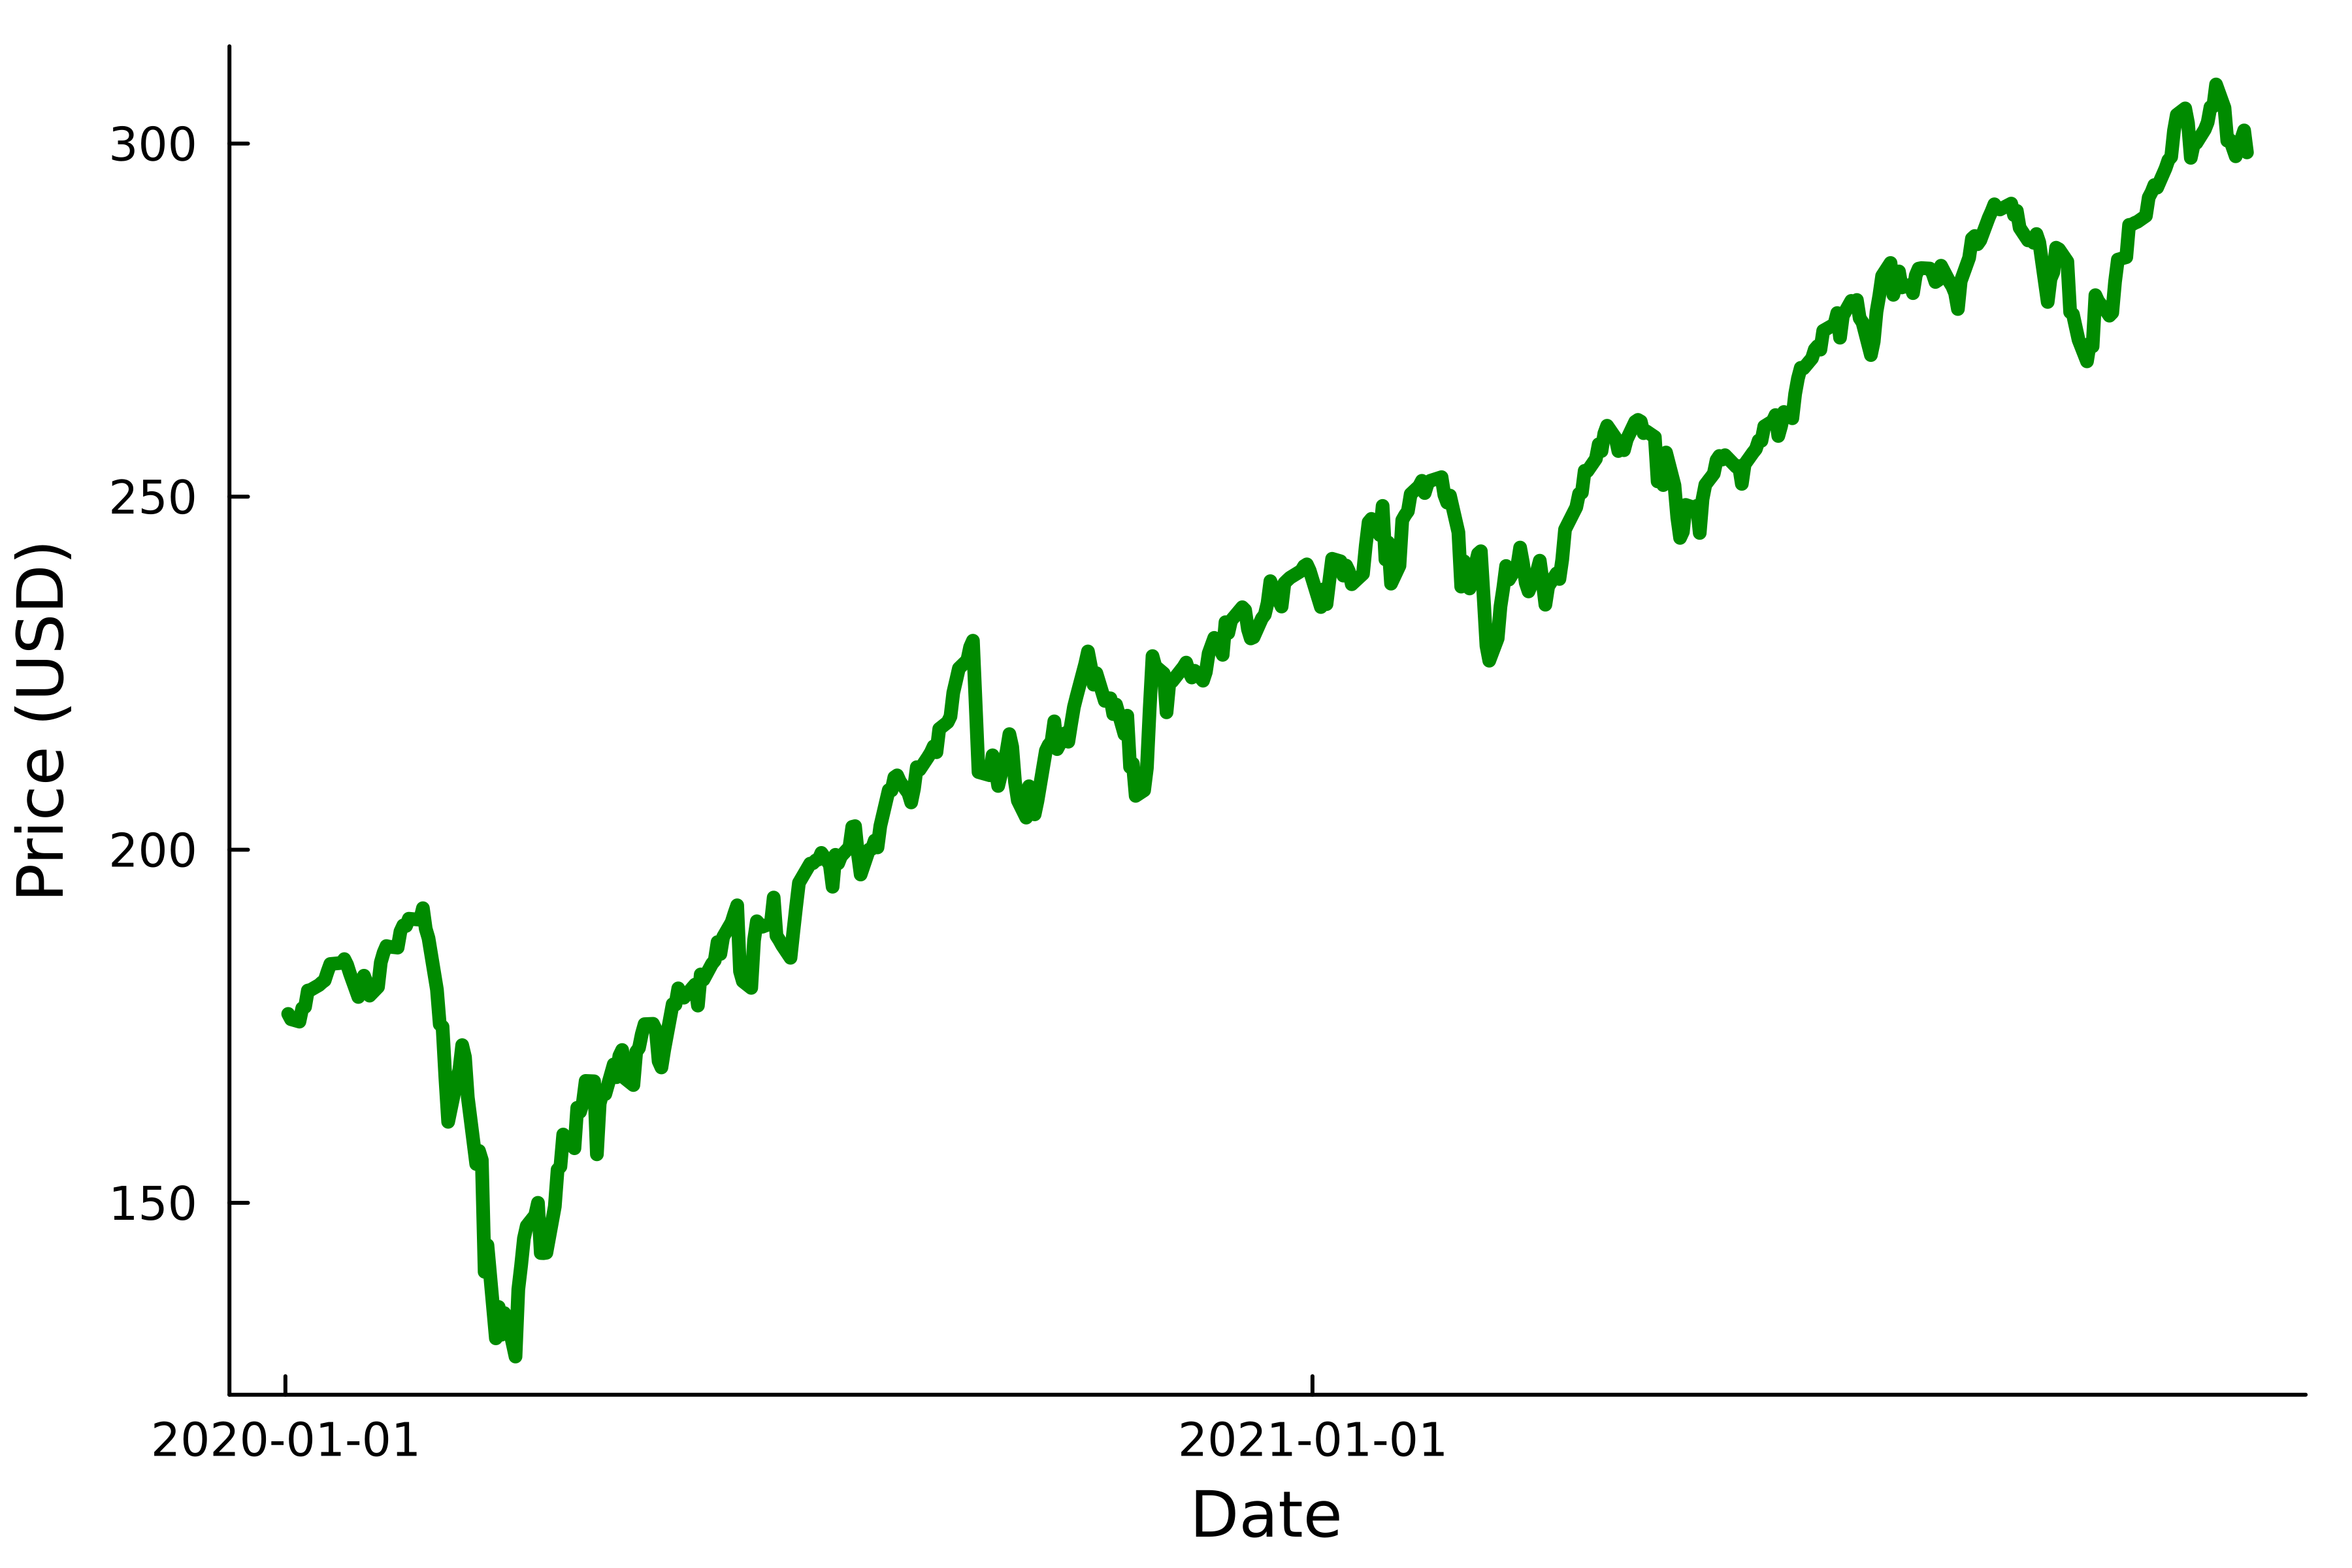
Table versus graph
- Visualize categories

A preview of our plotting journey

A preview of our plotting journey


