Series Recipes

Introduction to Data Visualization with Julia

Gustavo Vieira Suñe

Data Analyst

Customizing a plot

# Create a violin plot
violin(
    streaming.Fav_genre,
    streaming.Insomnia,
    framestyle=:grid, label=false,
    linewidth=0,

# Fill properties fillcolor=:purple, fillalpha=0.75,
# Permute the axes permute=(:x, :y),
# Remove grid lines grid=:off, )
xlabel!("Self-Reported Insomnia")

A horizontal violin plot of insomnia levels versus favorite music genre.

Introduction to Data Visualization with Julia

Plots.jl series

  • Collection of points sharing the same plotting characteristics
    • plot(x, y) points are a series of the :line type
  • Many series types, including :line, :scatter, :histogram, :density, :bar
  • A plot can have multiple series
    • scatter(x, [y1 y2]) has two series of type :scatter
    • Each column is a series
  • Plots.jl follows a different recipe for each series type
    • We can create our own custom recipes!
Introduction to Data Visualization with Julia

It's all plot in the end

# Create a violin plot
plot(
    streaming.Fav_genre,
    streaming.Insomnia,
    framestyle=:grid, label=false,
    linewidth=0,
    fillcolor=:purple,
    fillalpha=0.75,
    permute=(:x, :y),
    grid=:off,

# Specify series type seriestype=:violin, )
xlabel!("Self-Reported Insomnia")

A horizontal violin plot of insomnia levels versus favorite music genre.

Introduction to Data Visualization with Julia

Custom series recipes

@recipe function f(
    ::Type{Val{:my_hviolin}}, x, y, z
)

# Series type seriestype := :violin
# Customization options framestyle := :grid label := false linewidth := 0 fillcolor := :purple fillalpha := 0.75 permute := (:x, :y) end
  • ::Type{Val{:my_hviolin}} defines my_hviolin as the series recipe name

  • x, y, z represent the series data

  • seriestype gives the type of the series used in the recipe

  • Customization arguments set with :=

Introduction to Data Visualization with Julia

Using custom series recipe

# Use recipe
plot(
    streaming.Fav_genre,
    streaming.Insomnia,
    # Specify series recipe
    seriestype=:my_hviolin,
)

xlabel!("Self-Reported Insomnia")

A horizontal violin plot of insomnia levels versus favorite music genre.

Introduction to Data Visualization with Julia

Using custom series recipe

# Define my_hviolin function
@shorthands my_hviolin

# Use recipe my_hviolin( streaming.Fav_genre, streaming.Insomnia ) xlabel!("Self-Reported Insomnia")

A horizontal violin plot of insomnia levels versus favorite music genre.

Introduction to Data Visualization with Julia

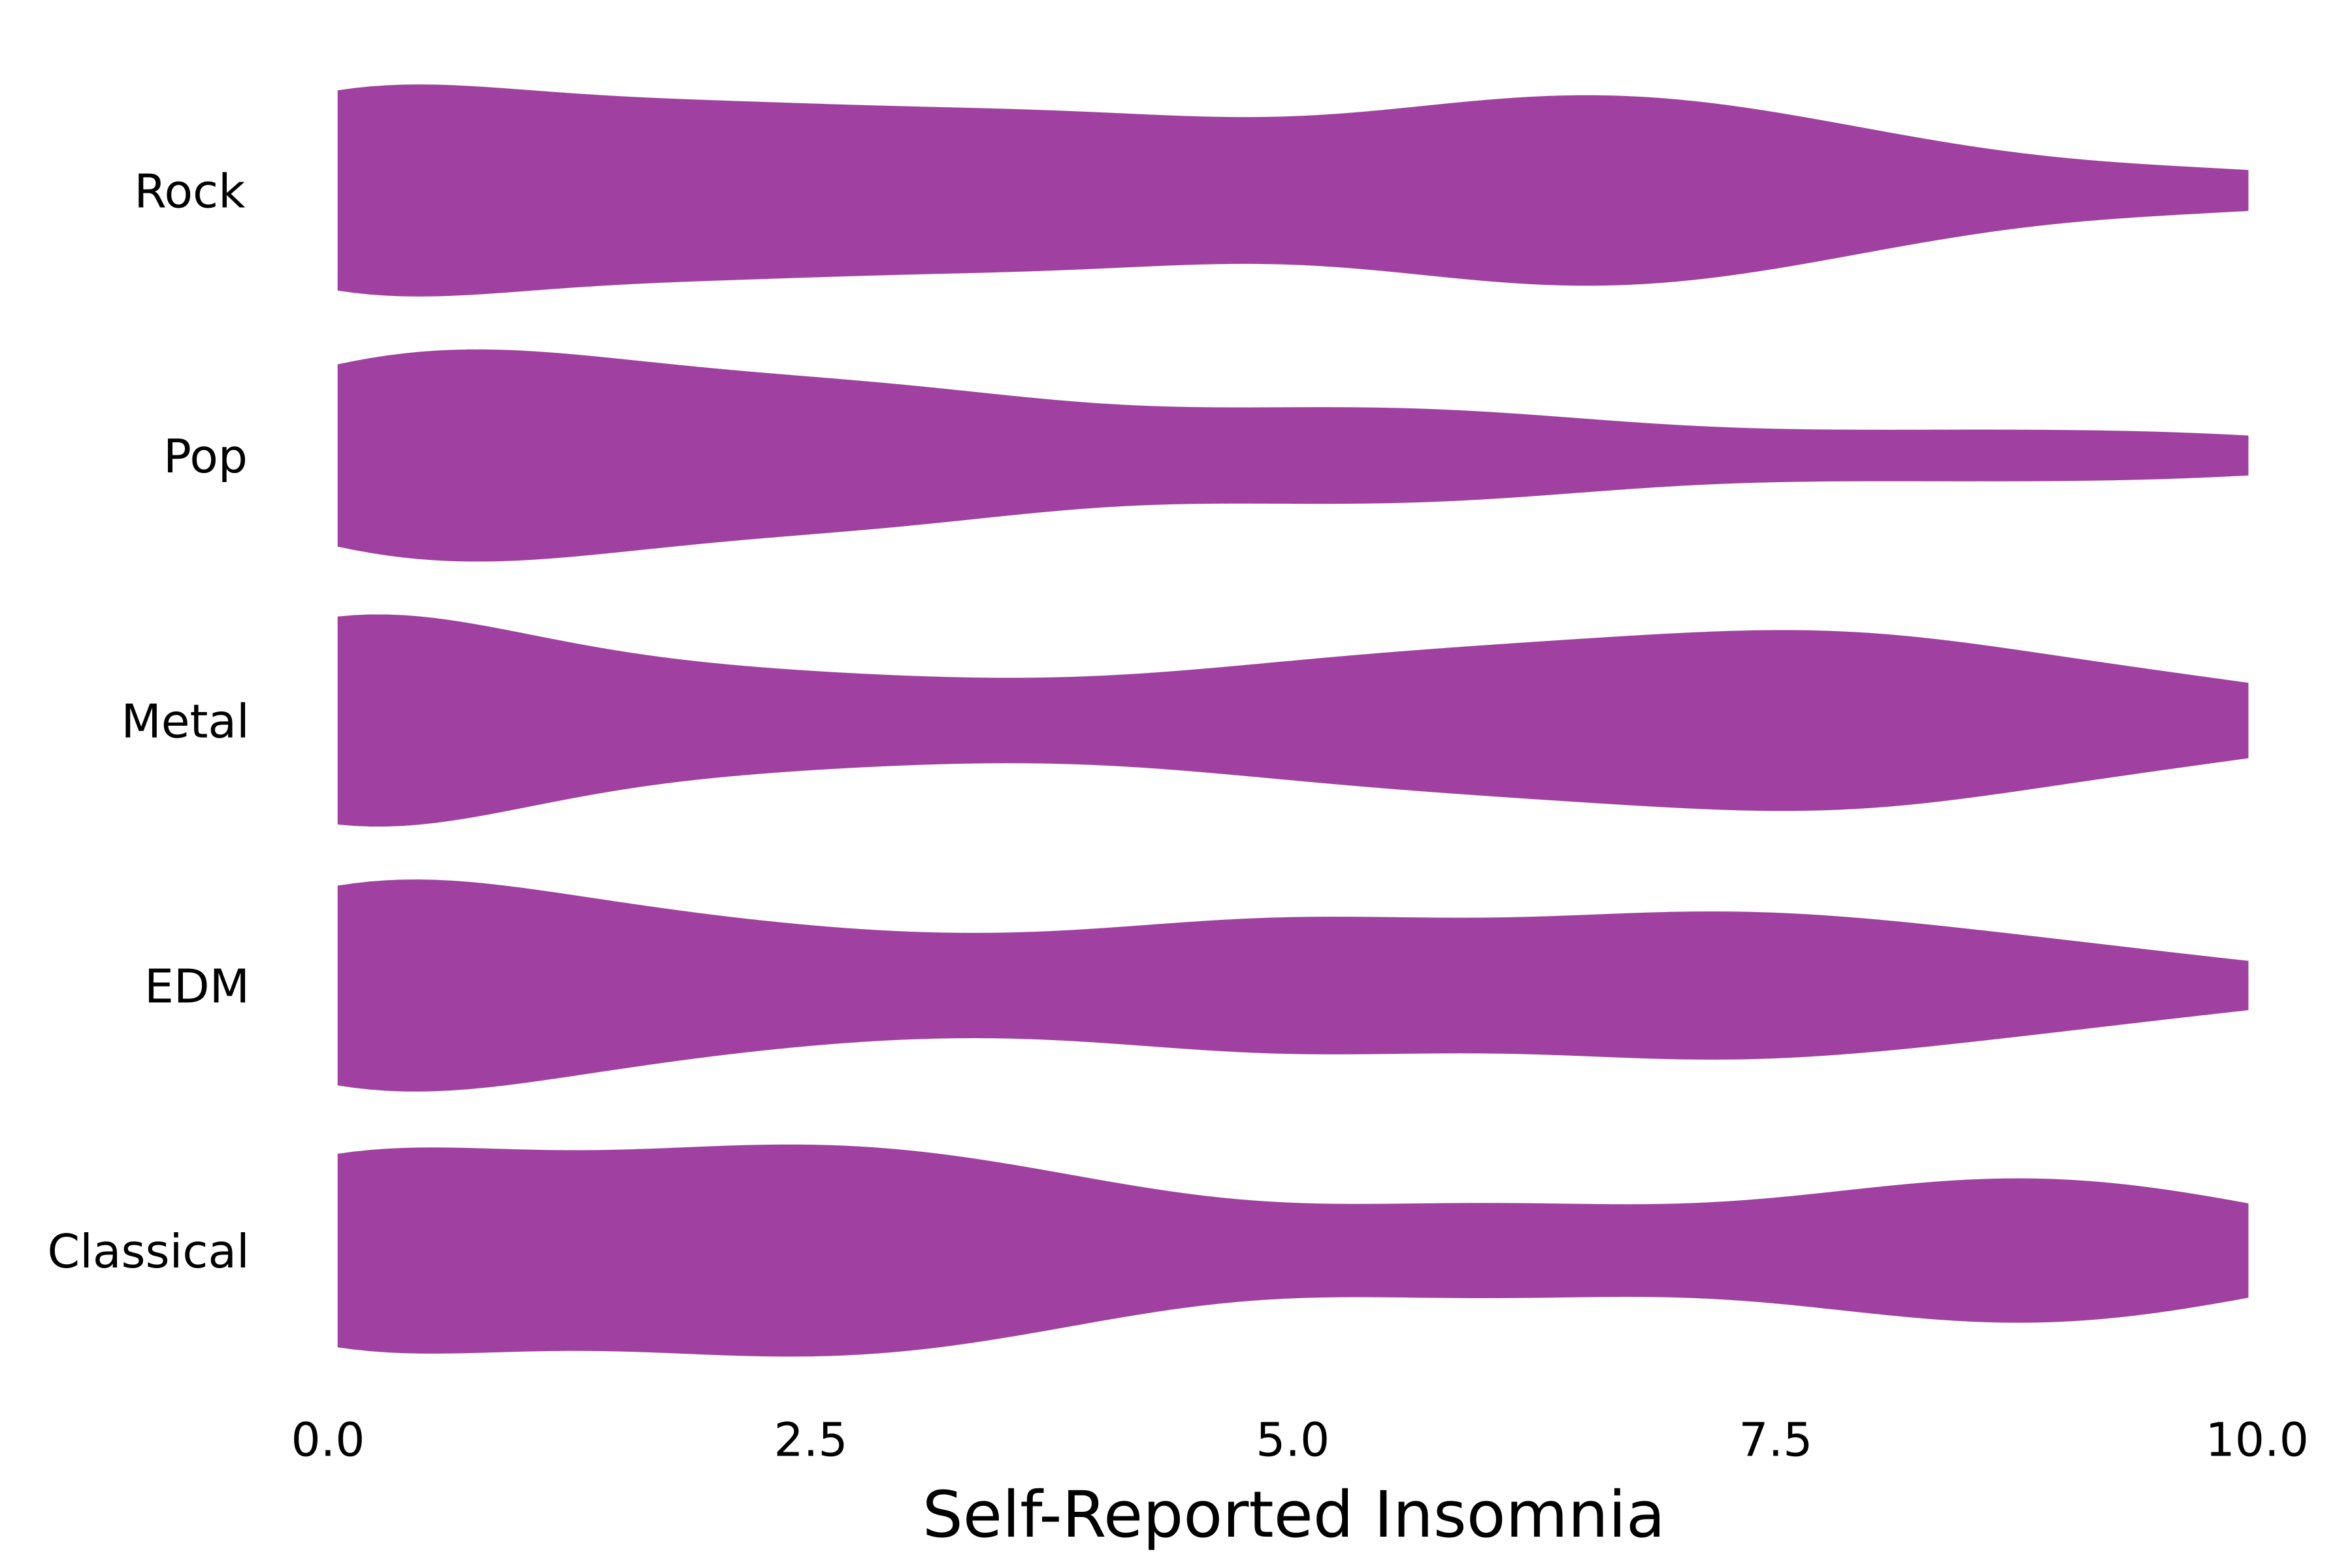
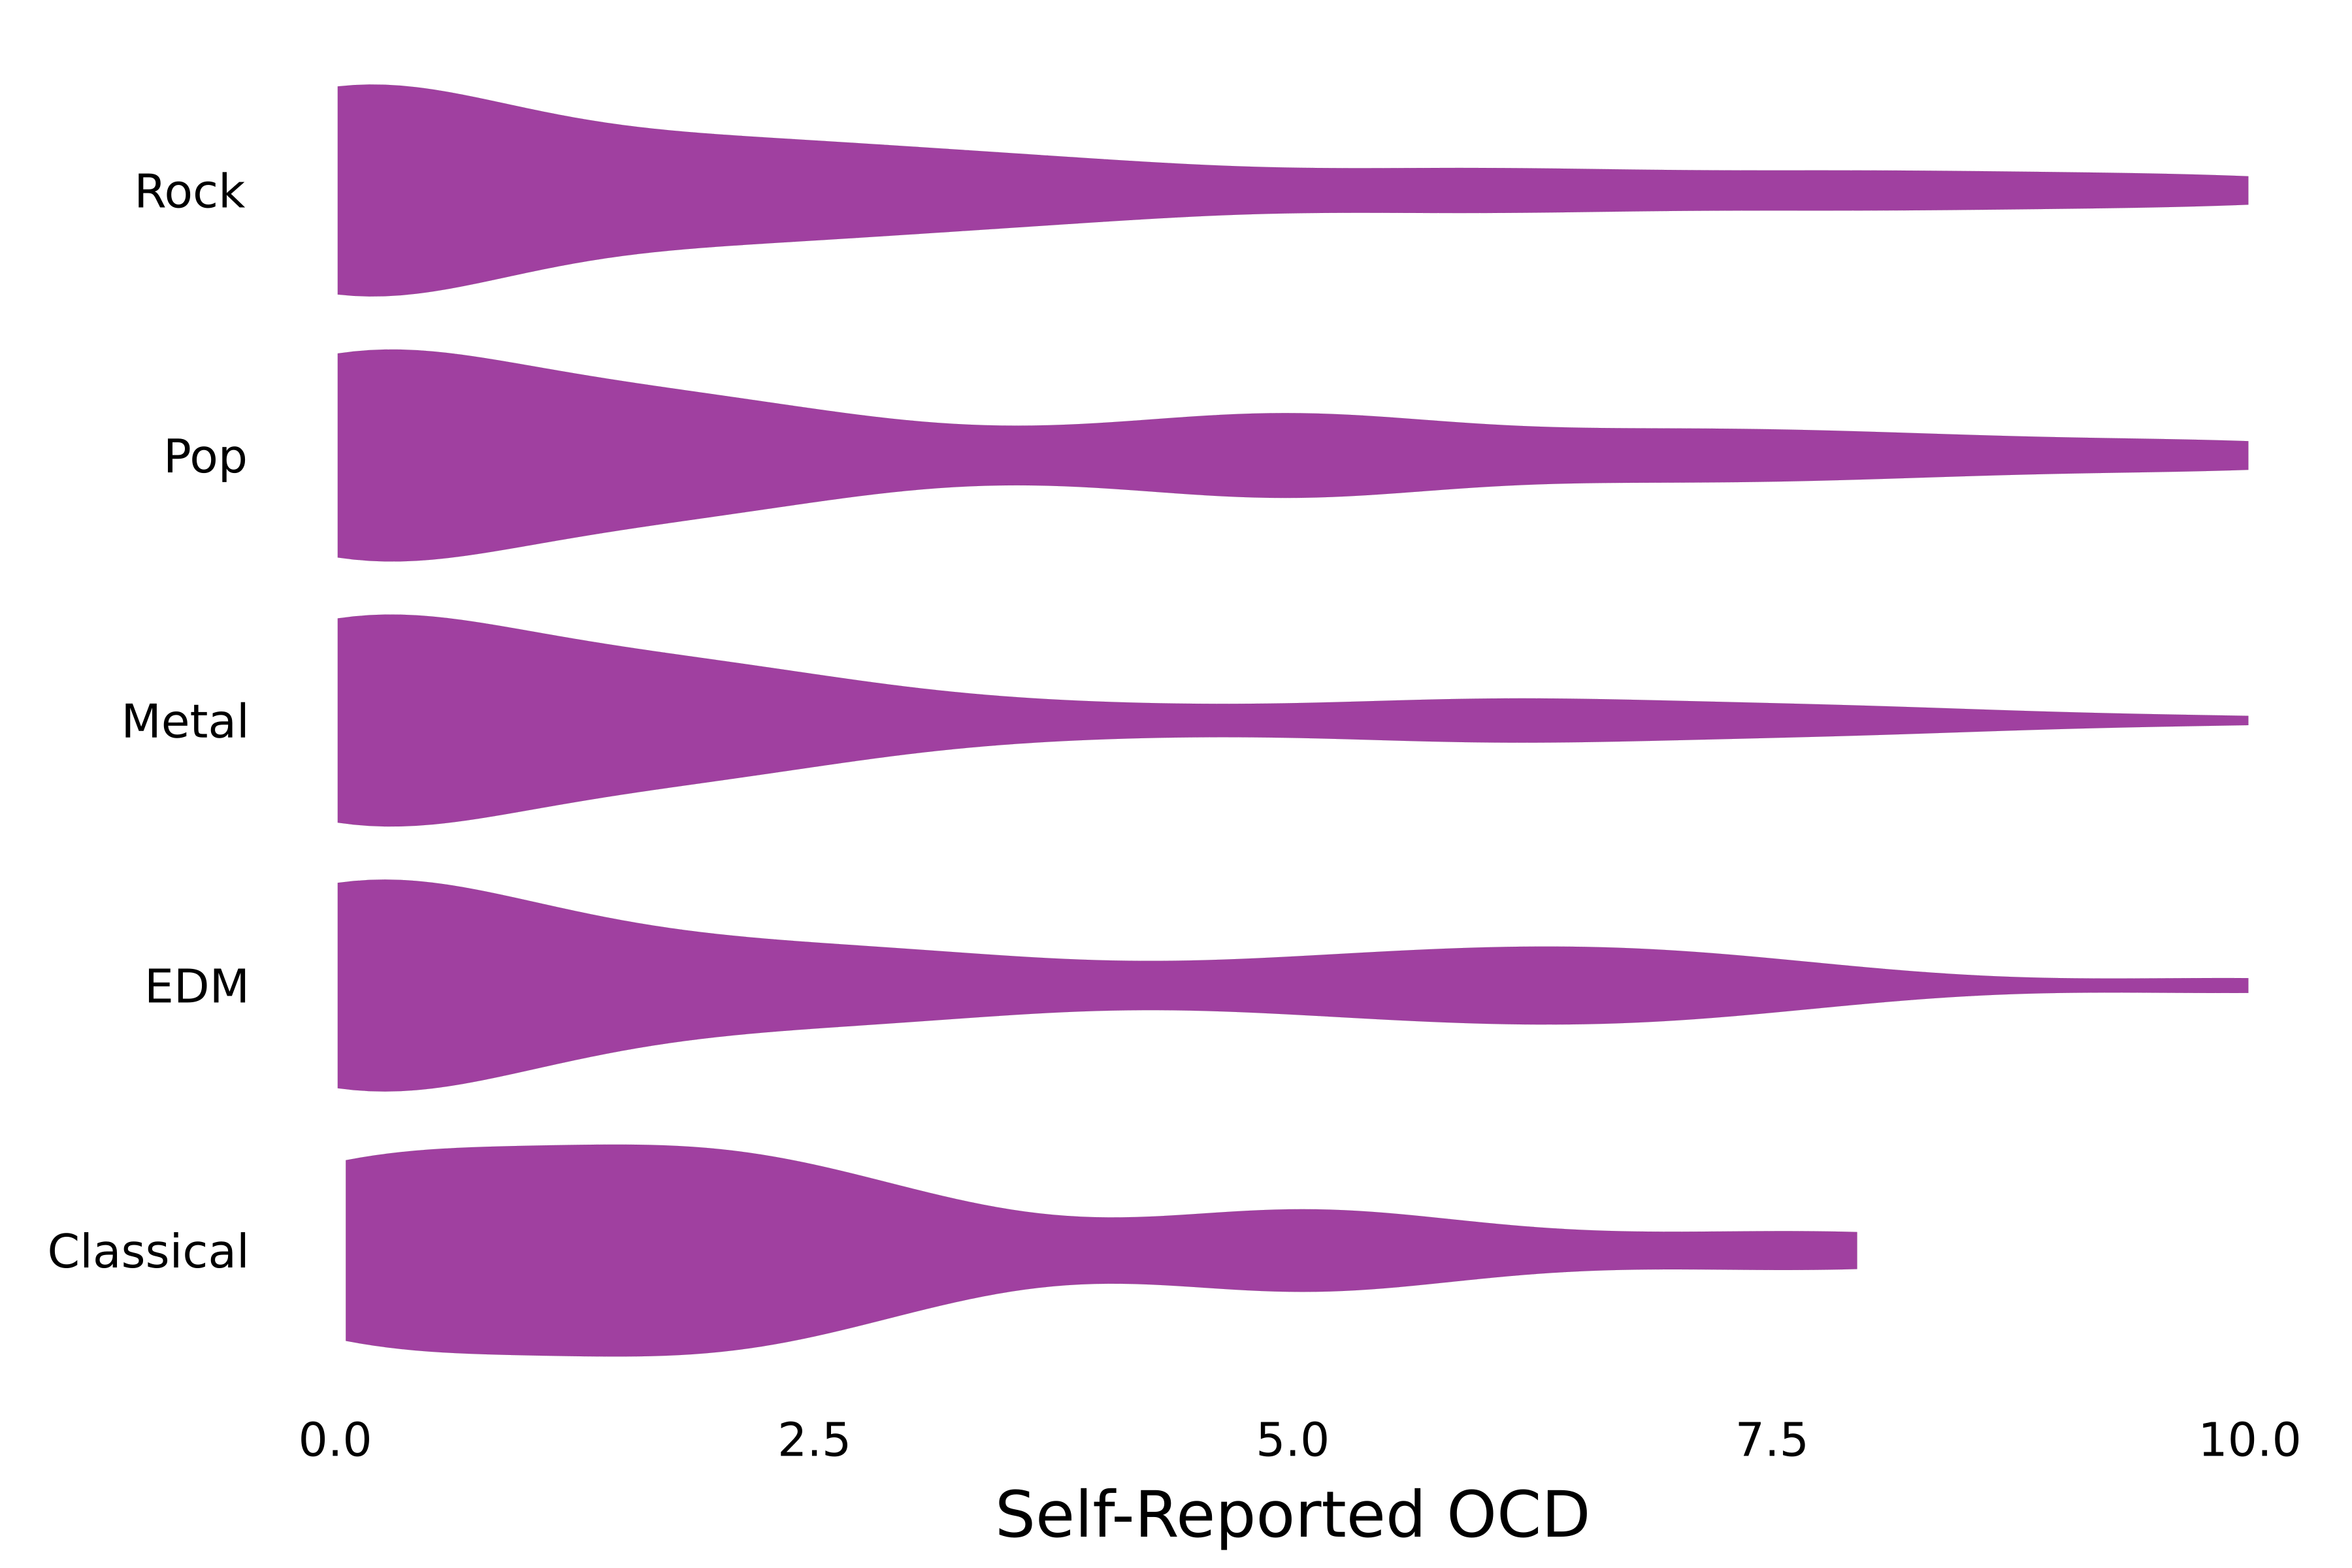
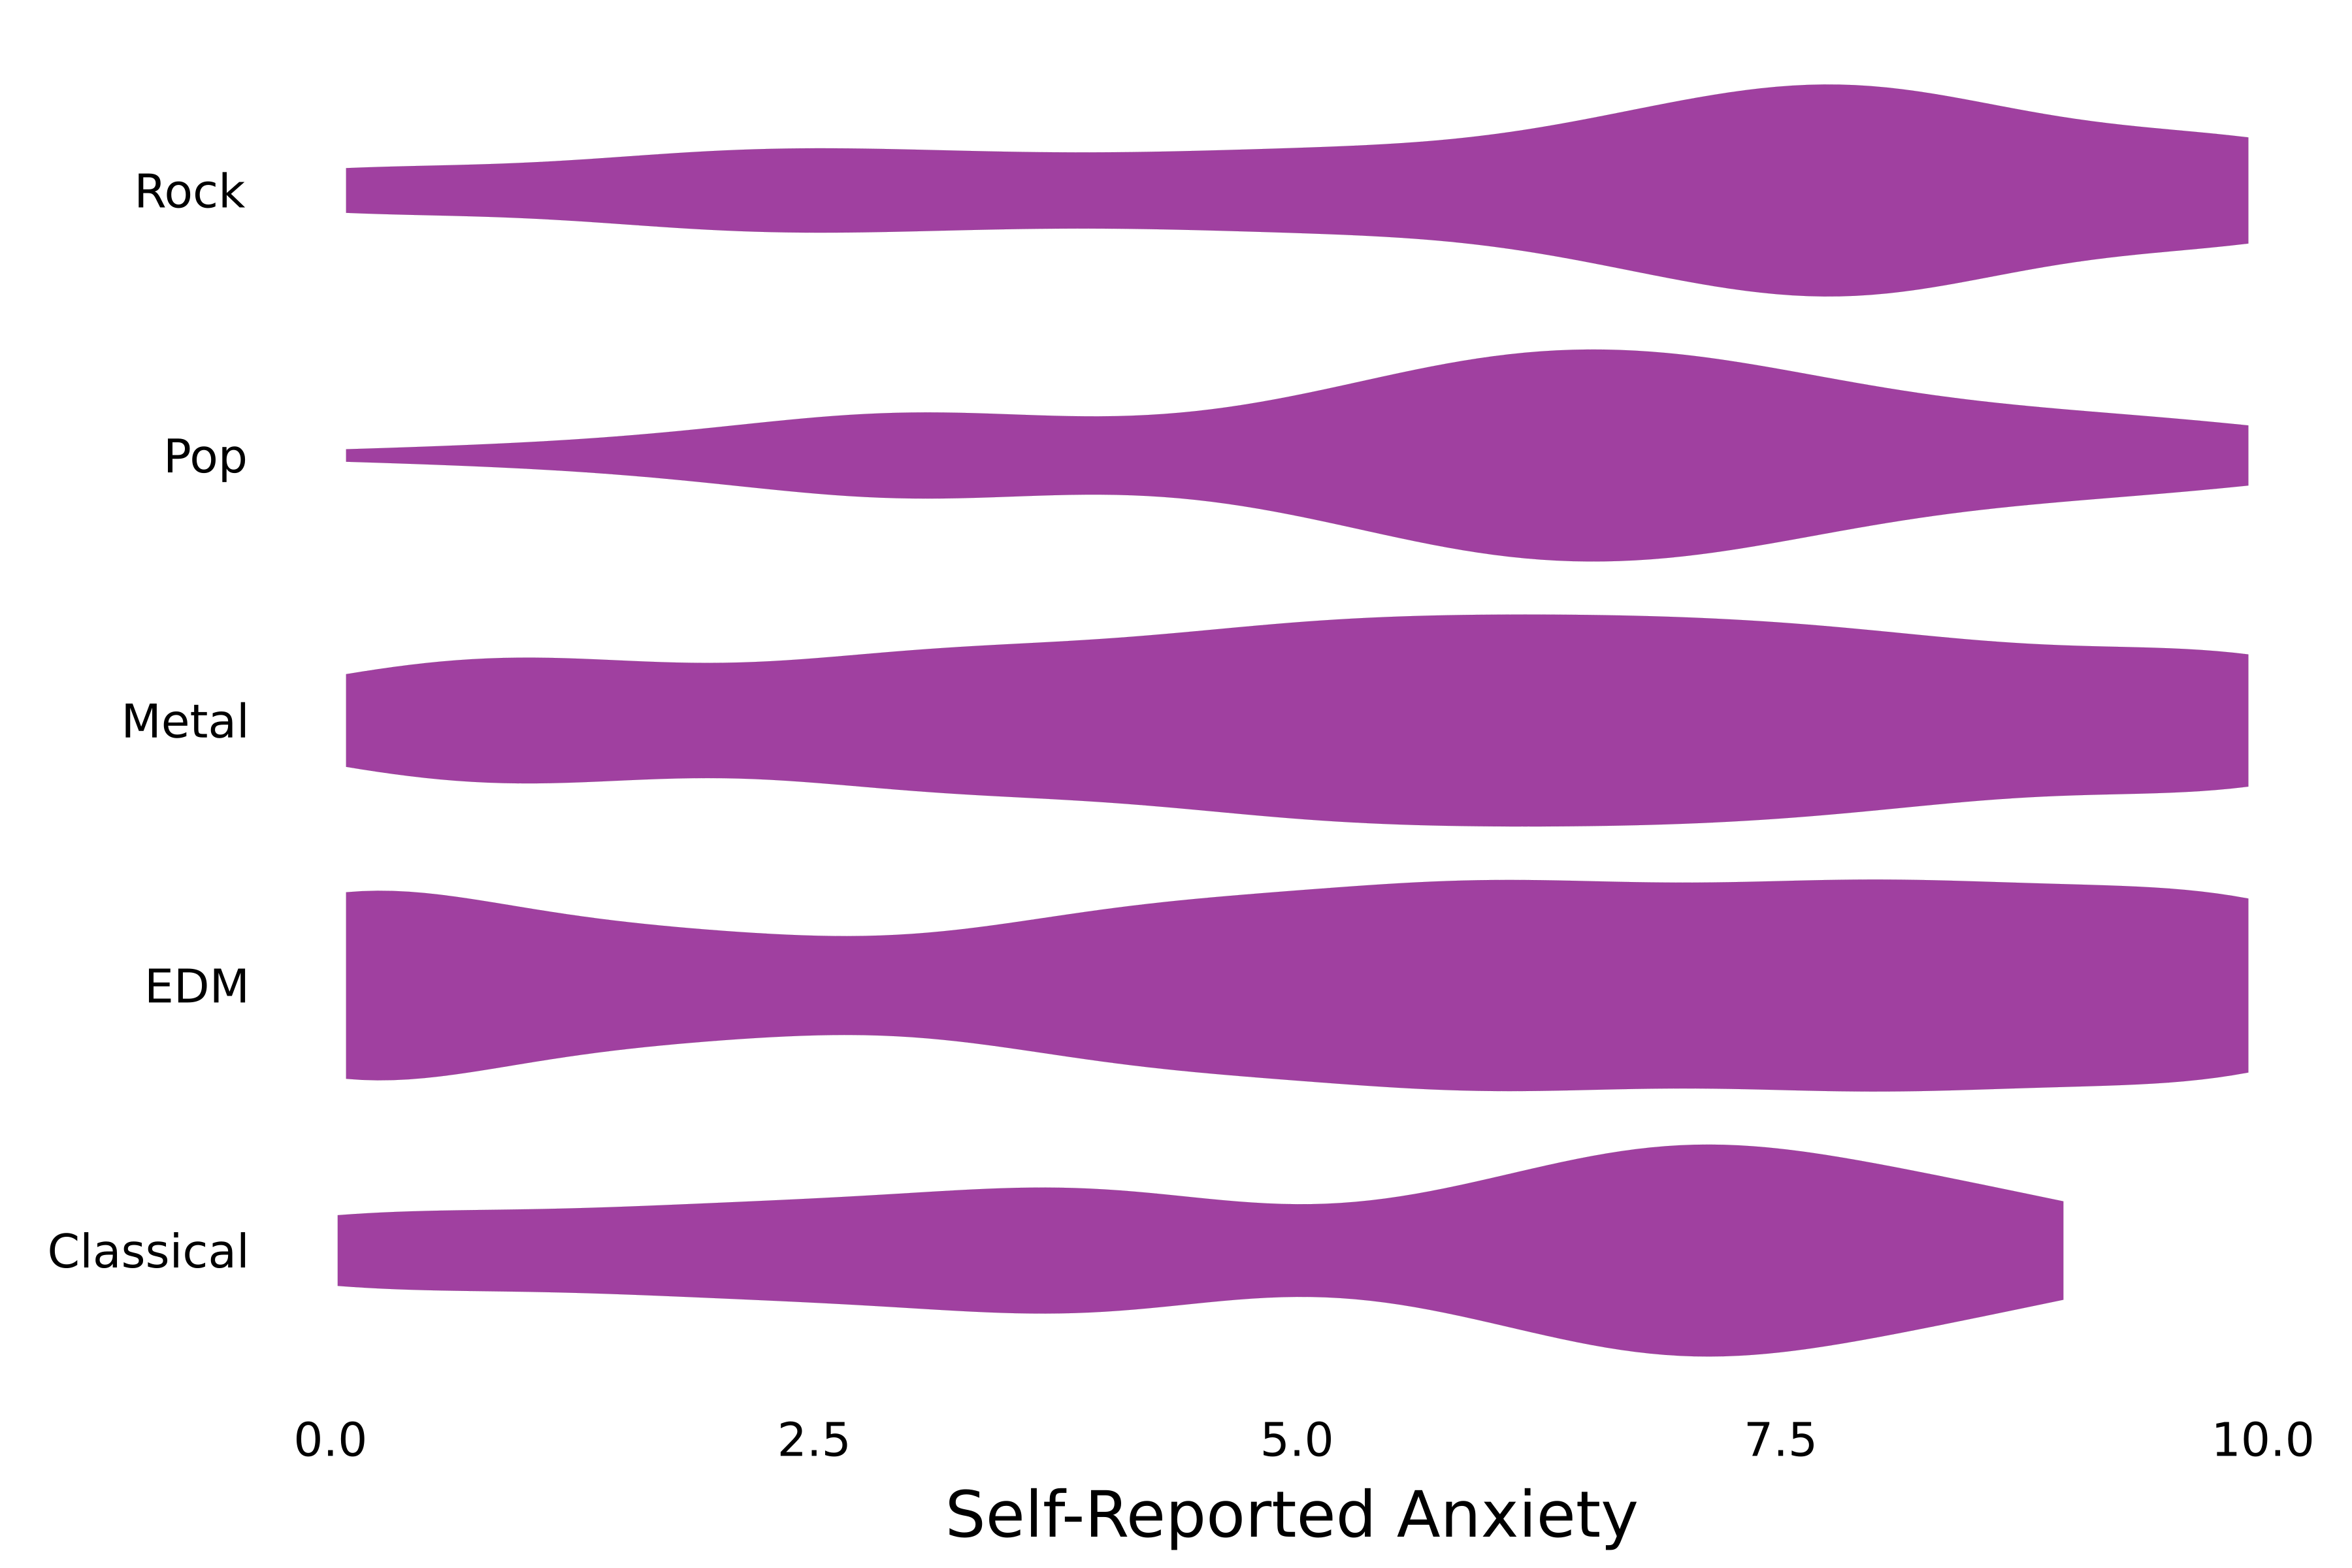
Same recipe, different data

my_hviolin(streaming.Fav_genre,
    streaming.OCD)
xlabel!("Self-Reported OCD")

A horizontal violin plot of OCD levels versus favorite music genre.

my_hviolin(streaming.Fav_genre,
    streaming.Anxiety)
xlabel!("Self-Reported Anxiety")
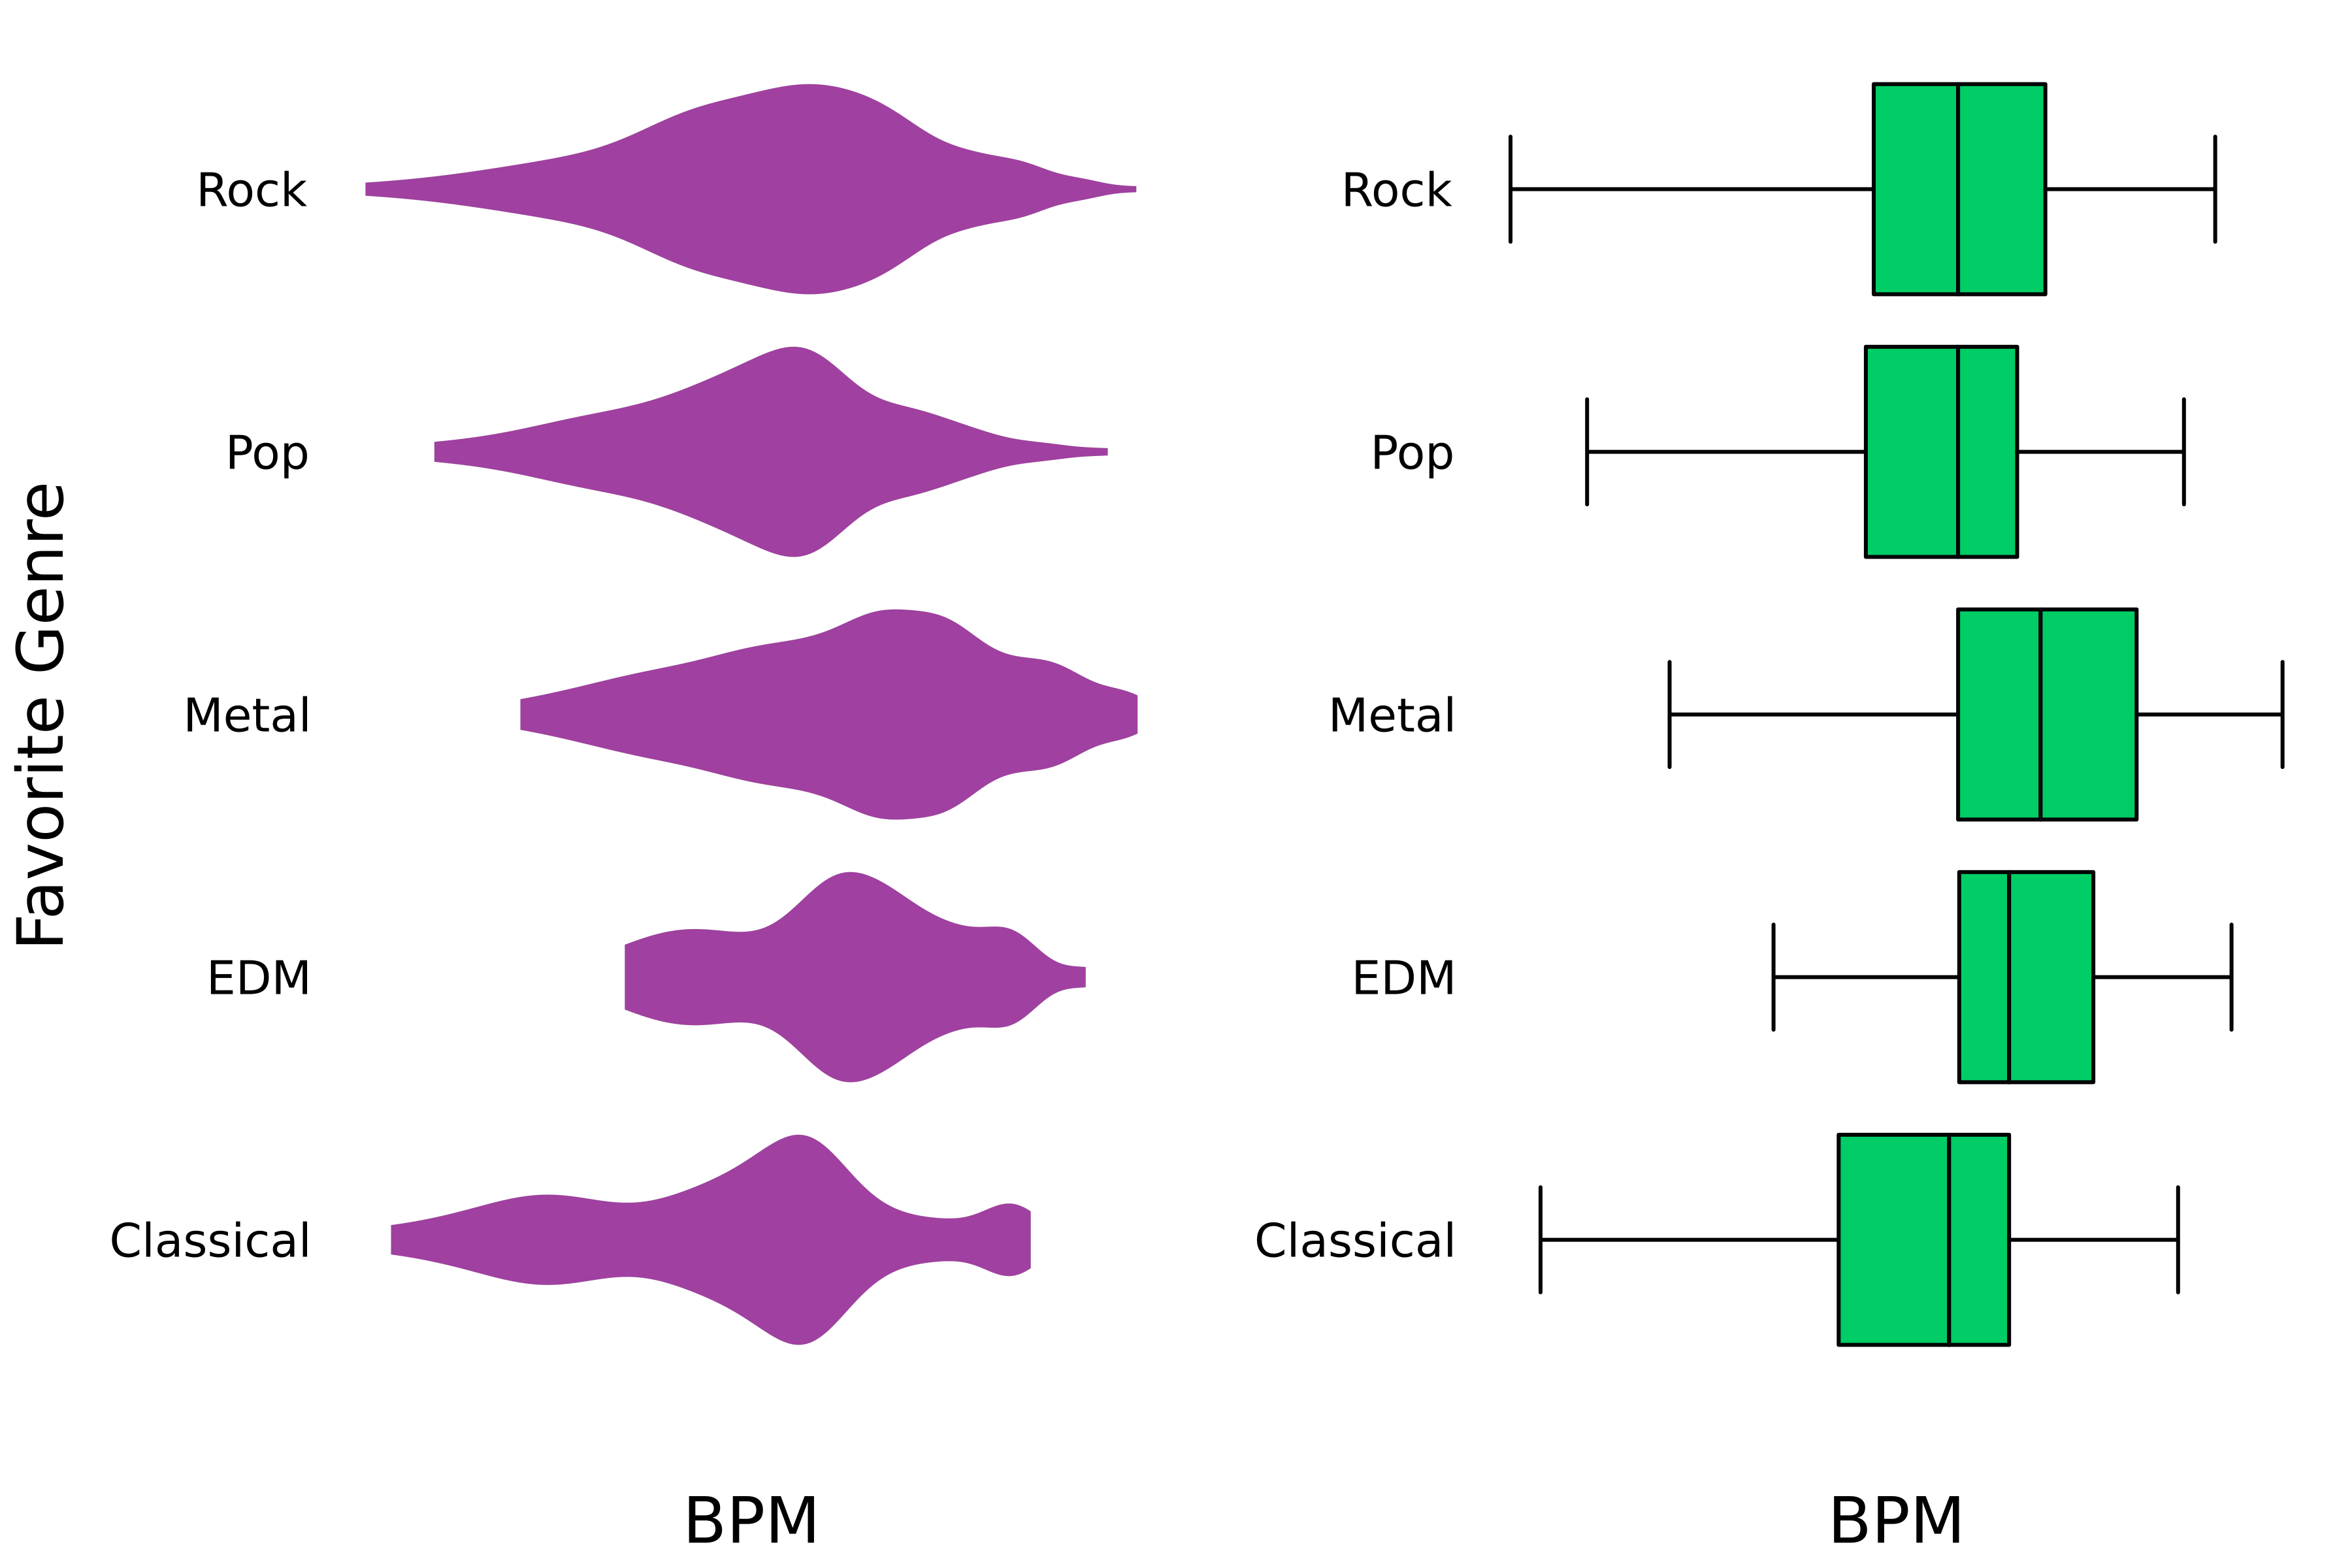
A horizontal violin plot of anxiety levels versus favorite music genre.

Introduction to Data Visualization with Julia

Plot recipes

  • Multiple series

A one-by-two grid of plots. It shows a violin and a box plot of BPM versus favorite genre.

1 https://docs.juliaplots.org/latest/recipes/
Introduction to Data Visualization with Julia

Let's practice!

Introduction to Data Visualization with Julia

Preparing Video For Download...