Getting started with Plots.jl
Introduction to Data Visualization with Julia

Gustavo Vieira Suñe
Data Analyst
Plots.jl
![]()
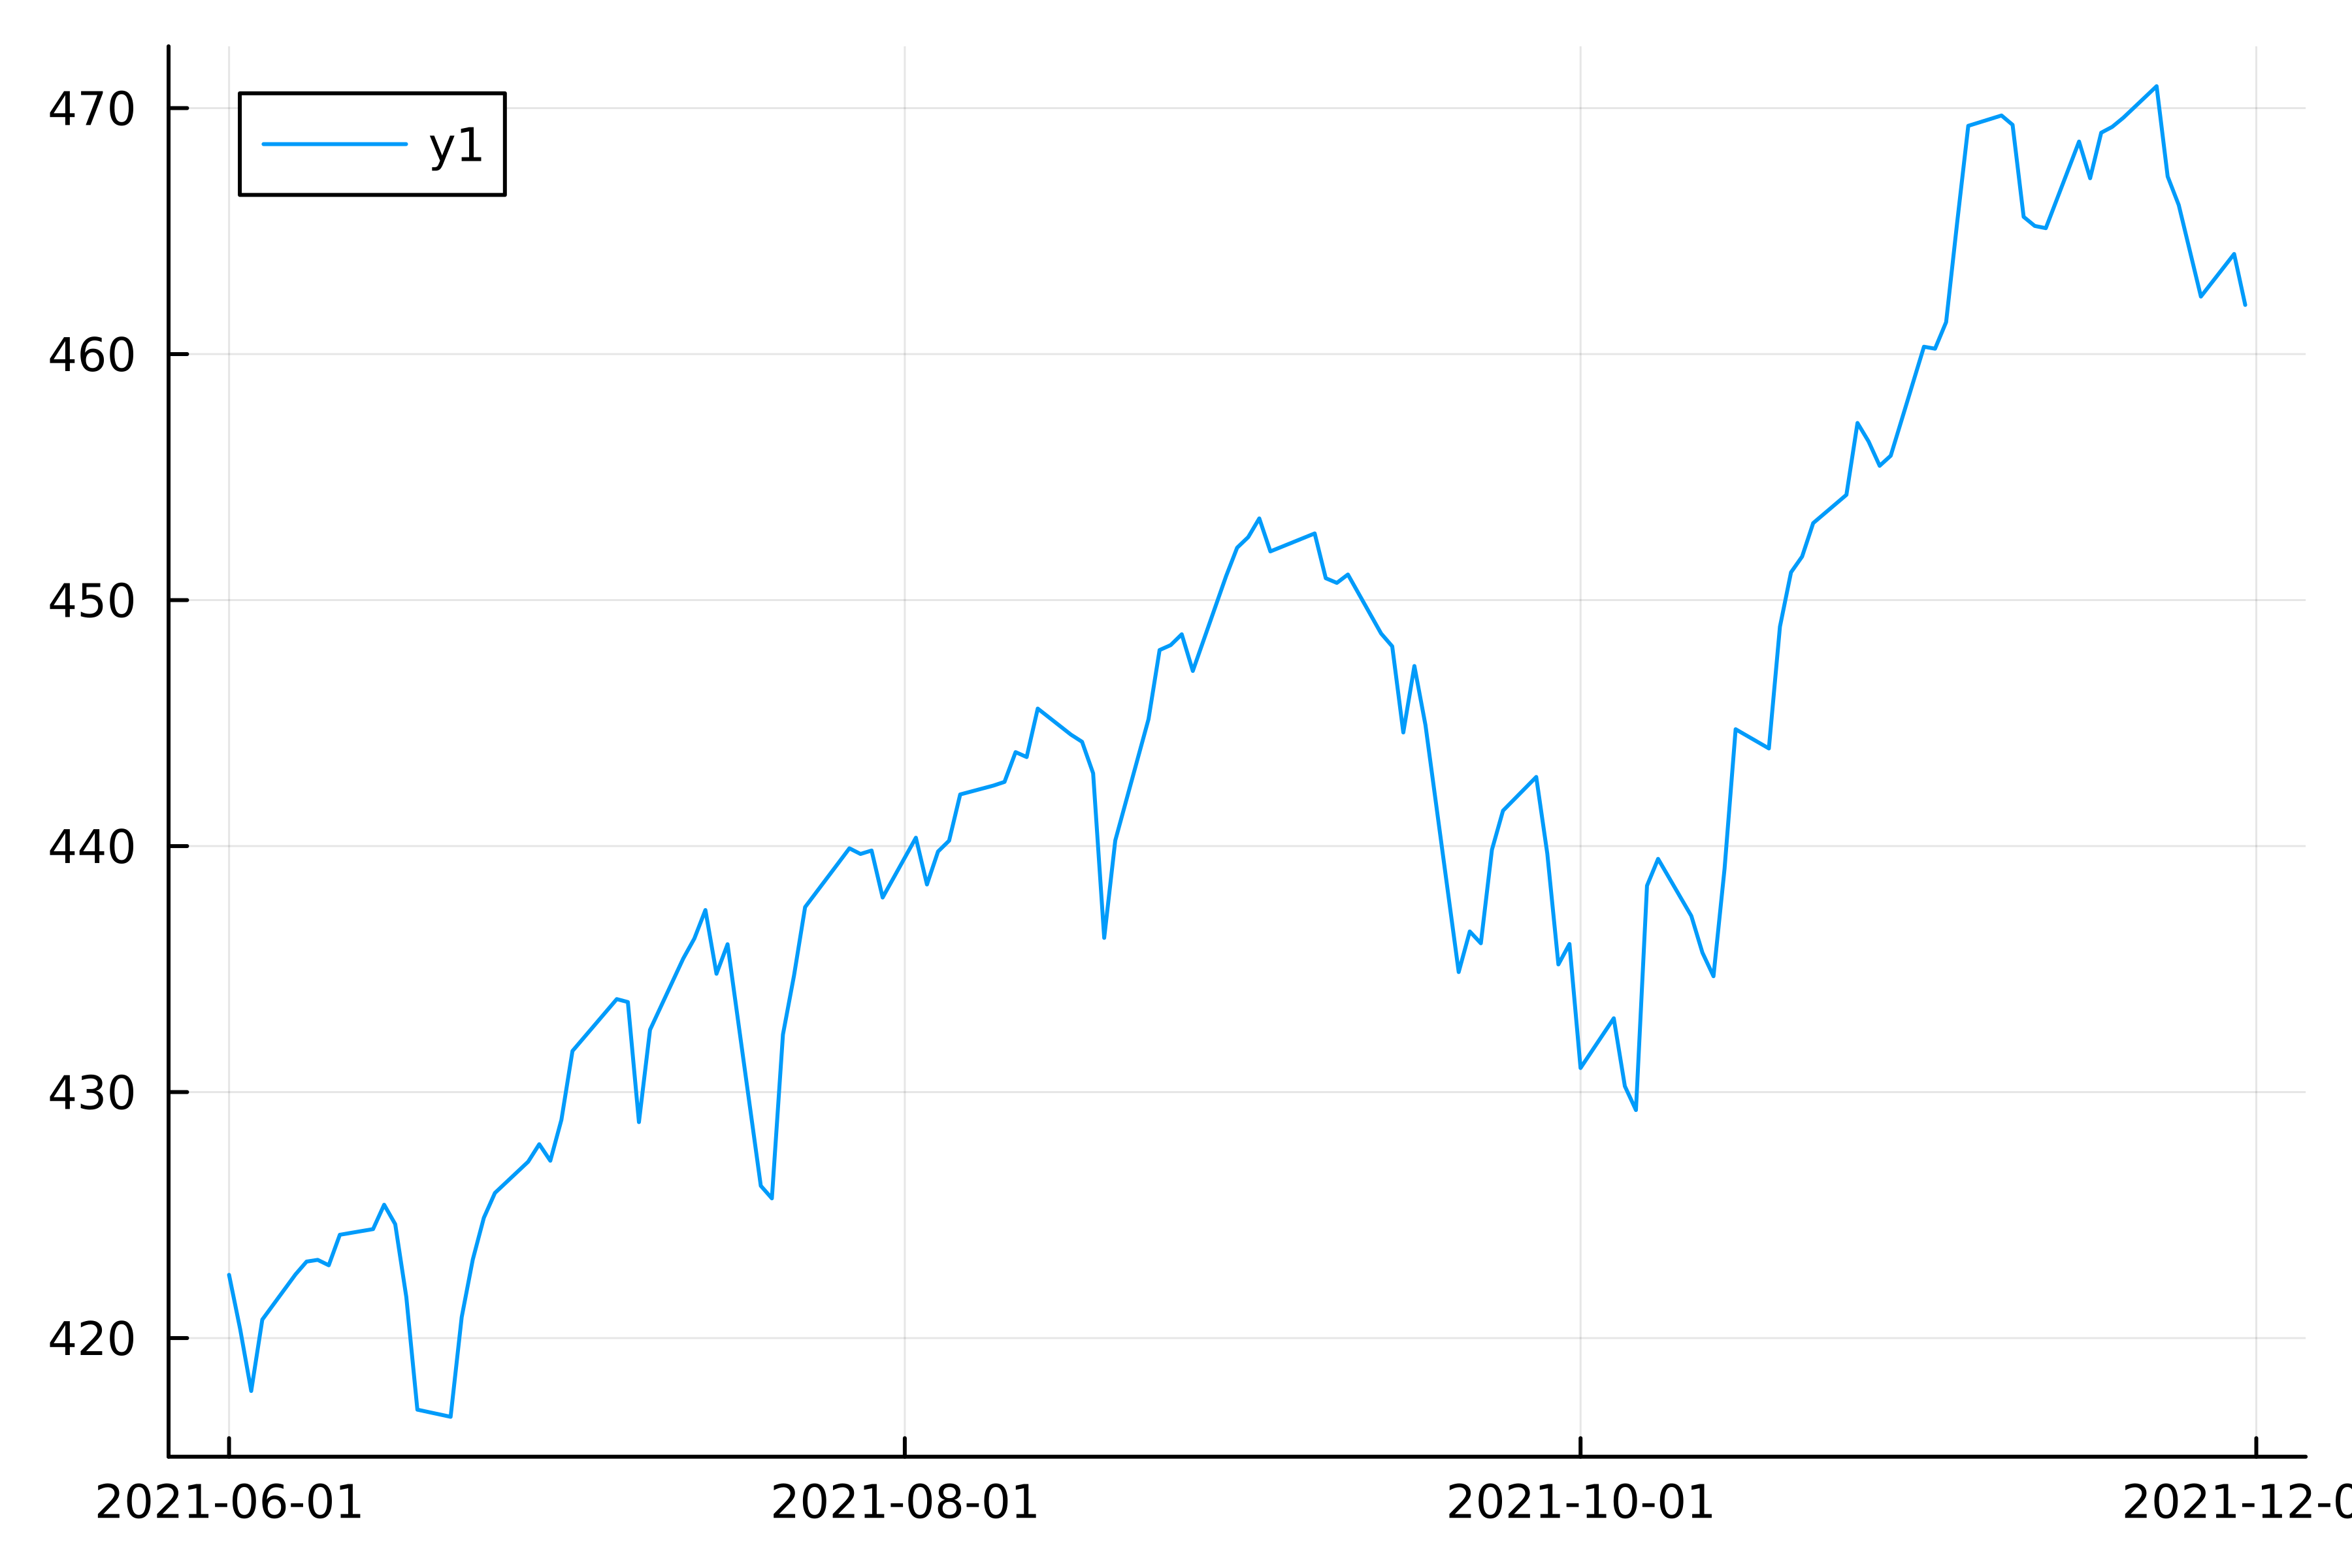
Our first Julia plot
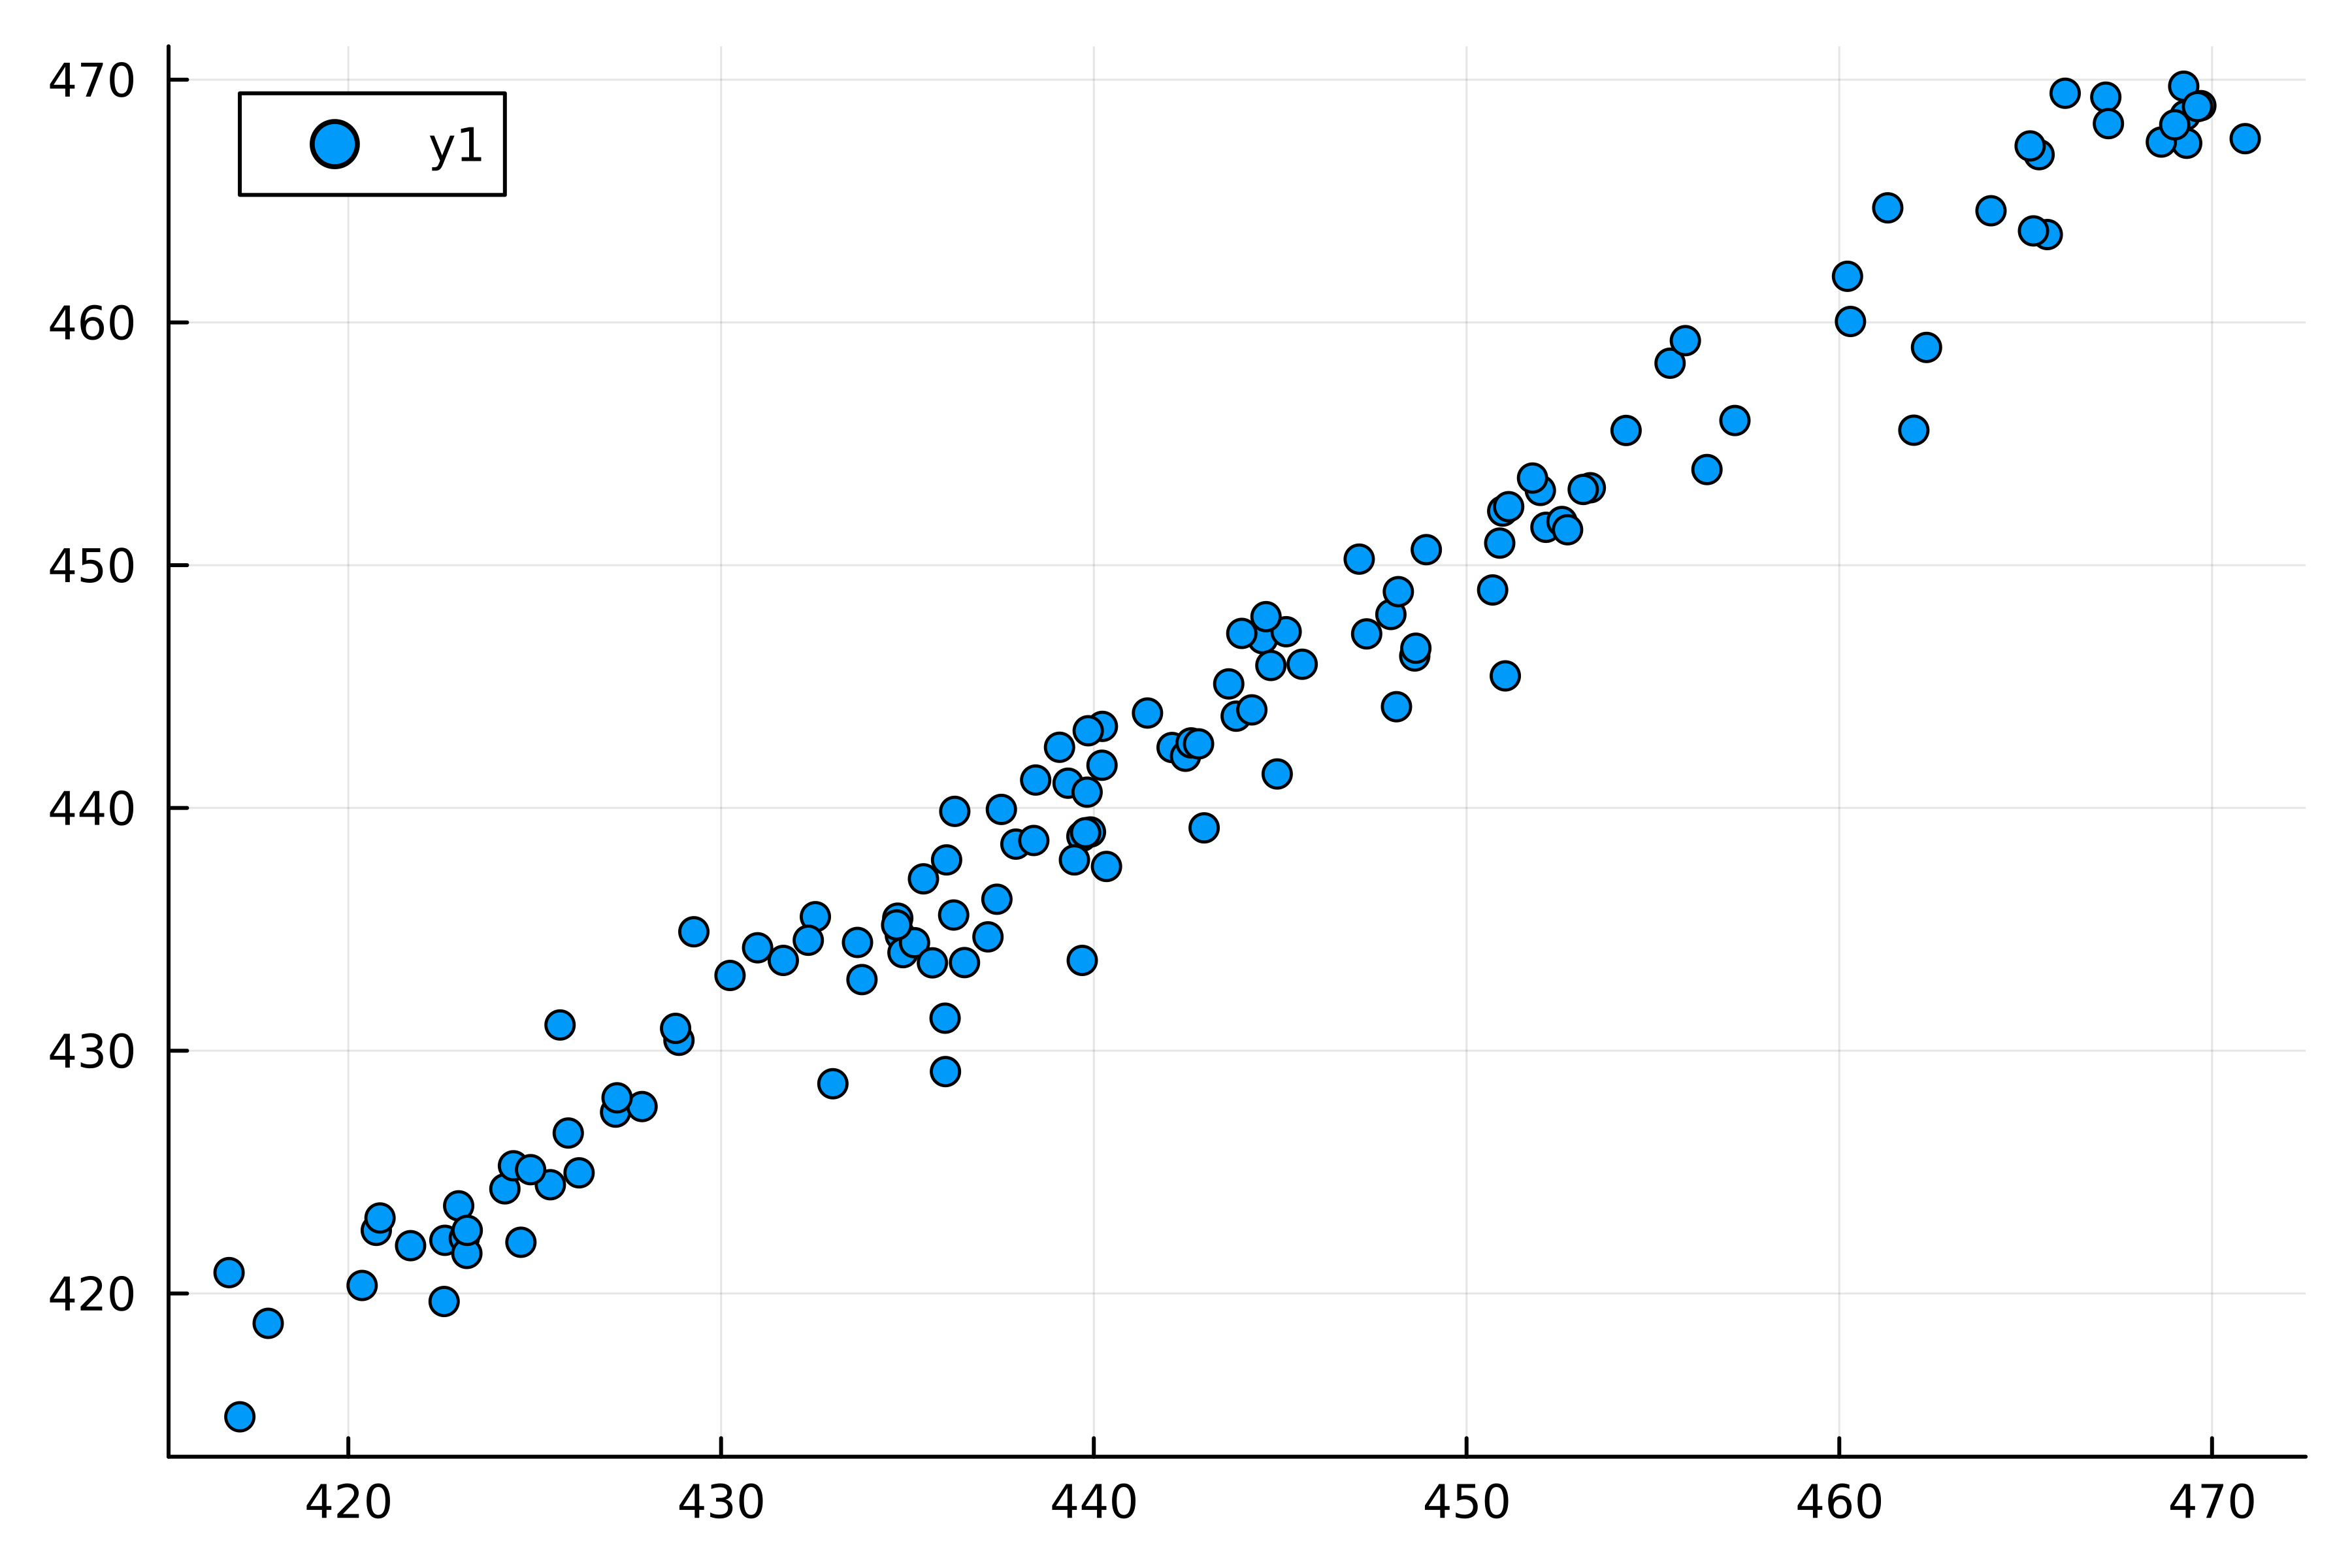
From lines to points
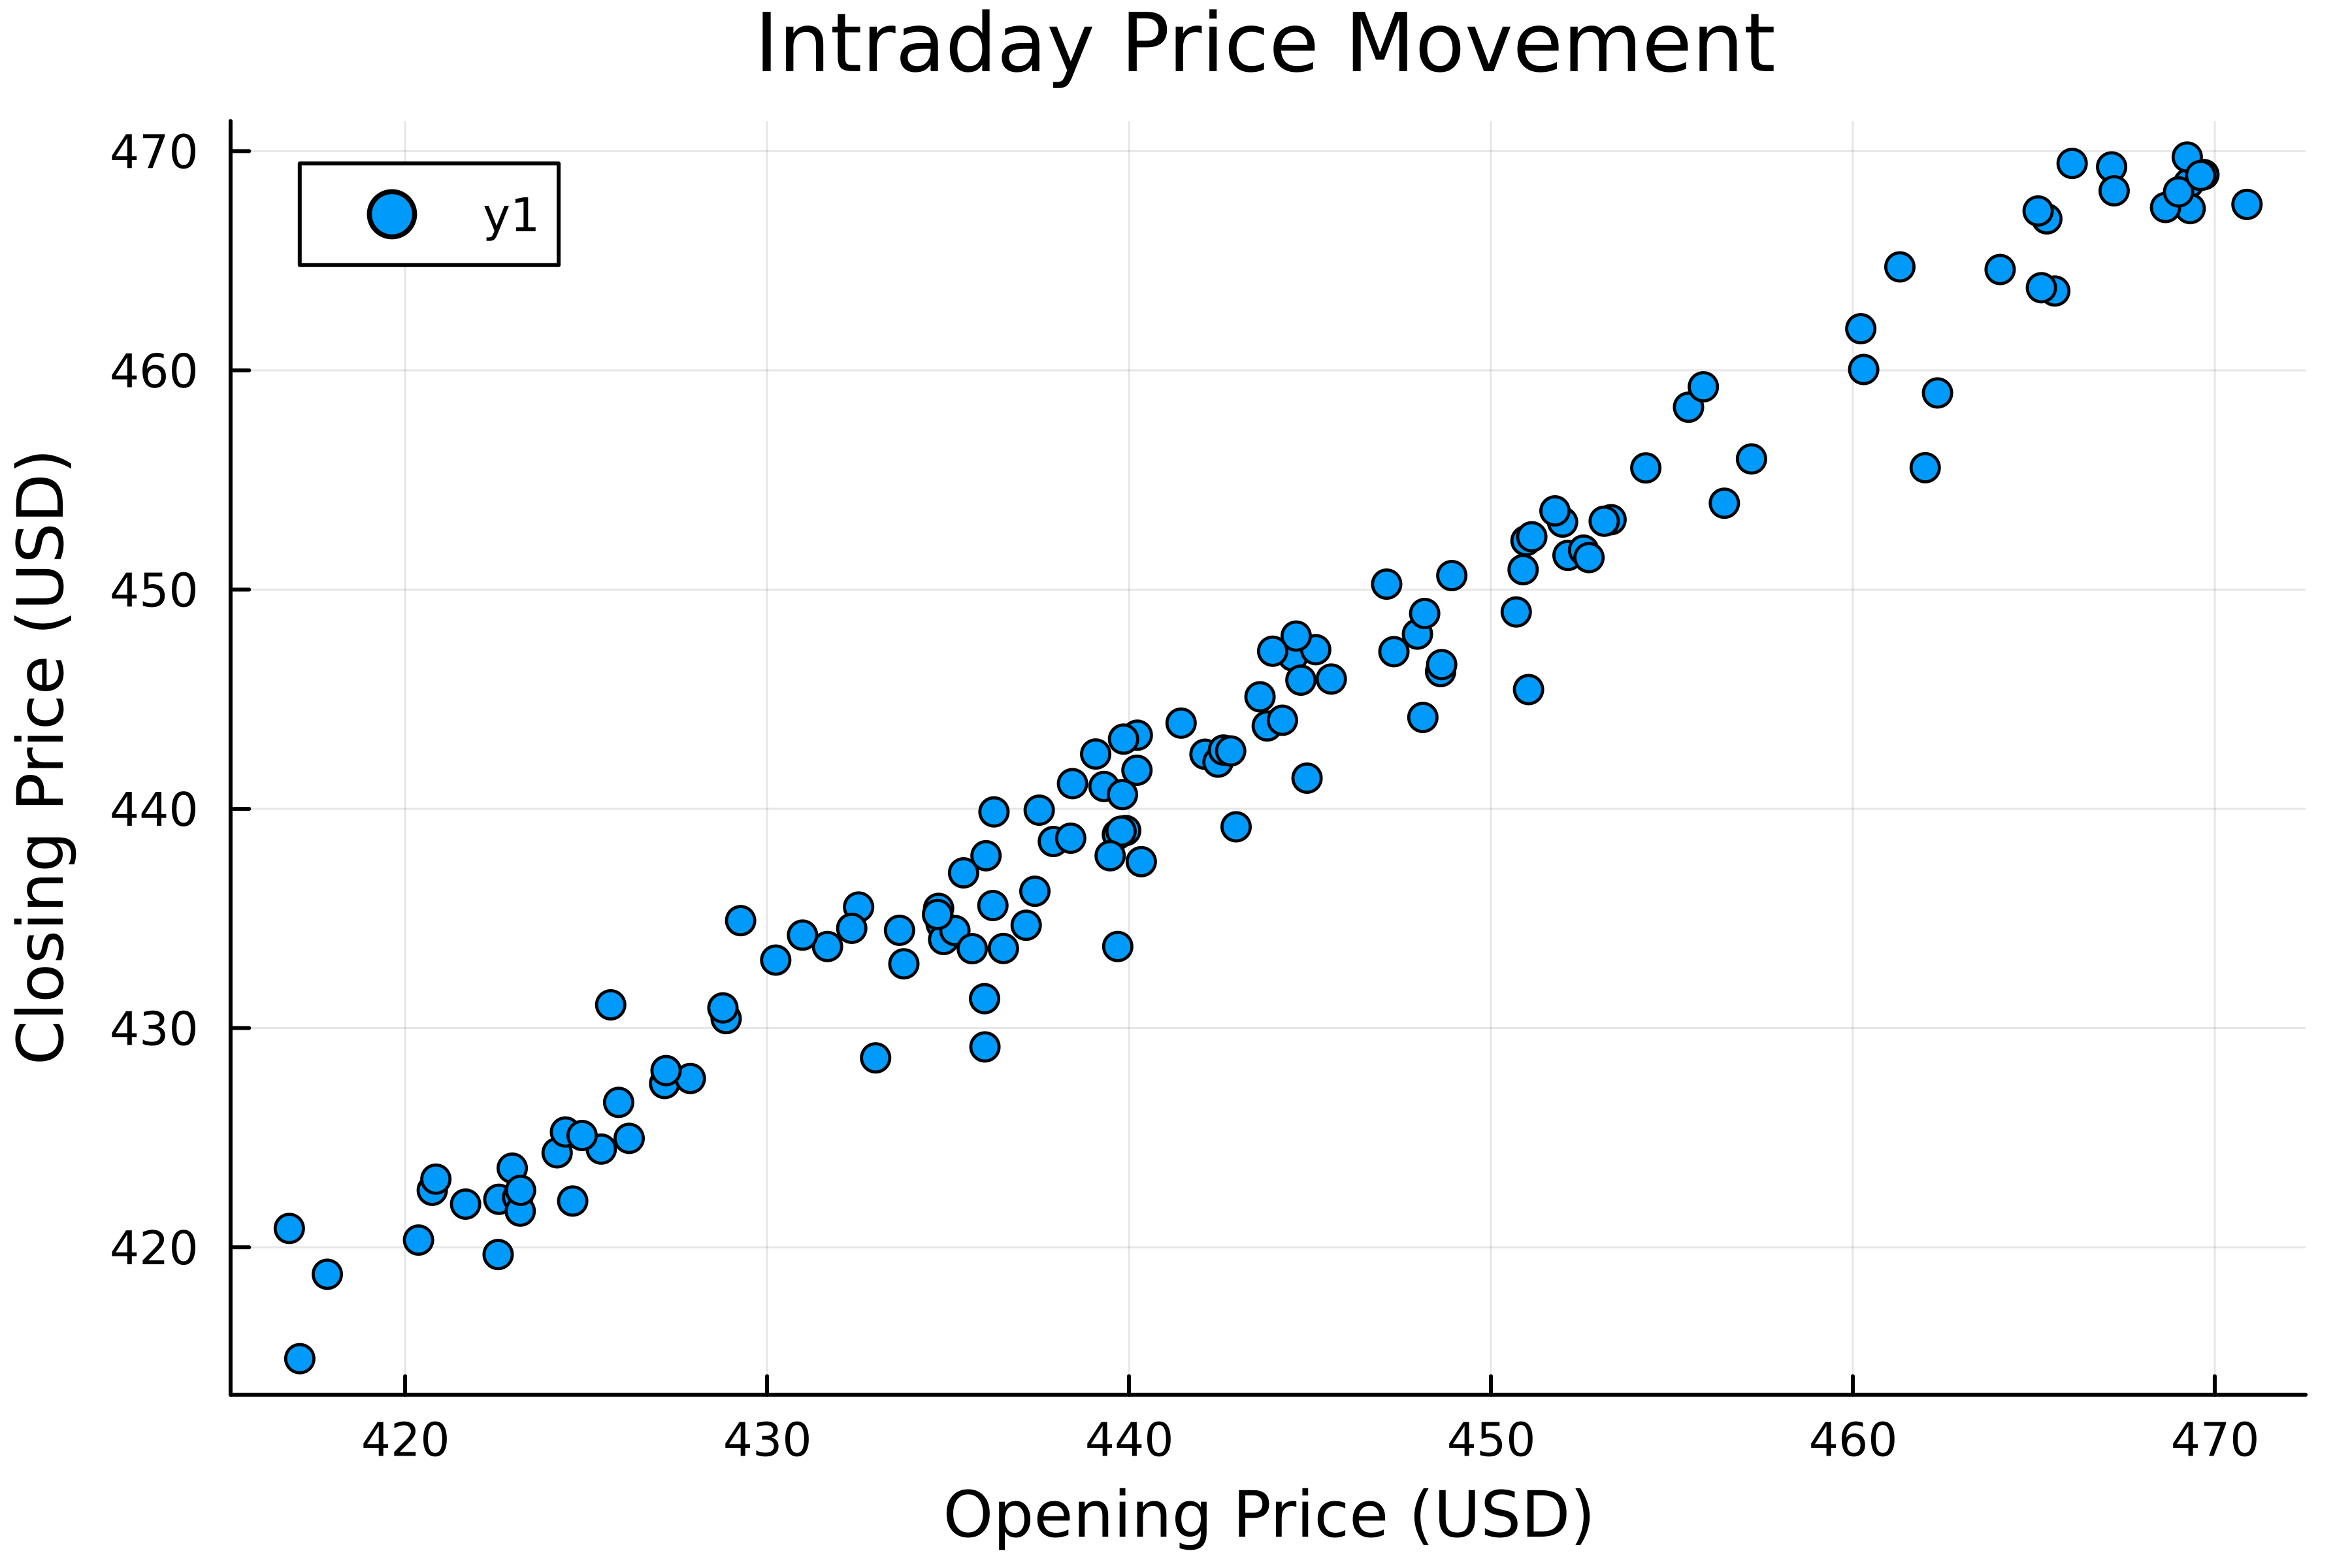
Adding title and axis labels
Introduction to Data Visualization with Julia
Gustavo Vieira Suñe
Data Analyst
![]()

