From problem to insights
Data Literacy Case Study: Remote Working Analysis

Maarten Van den Broeck
Senior Content Developer at DataCamp
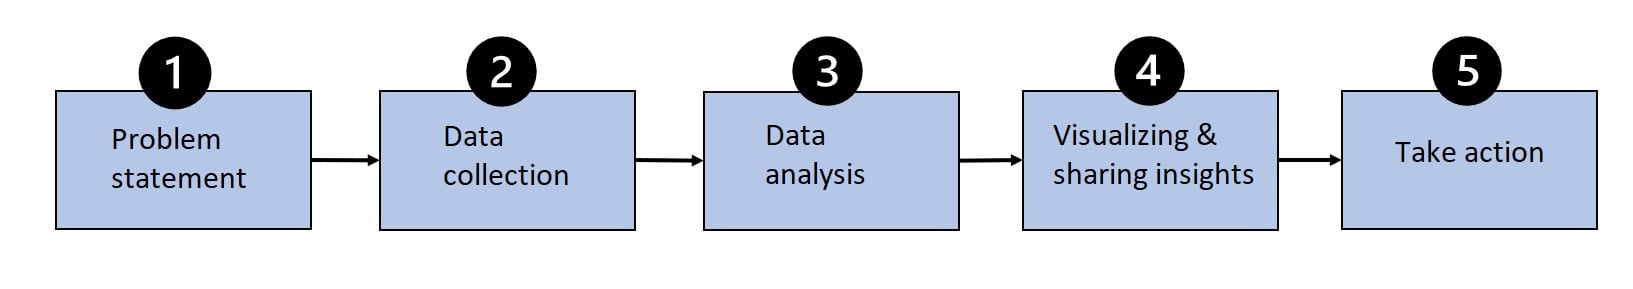
The data-driven process
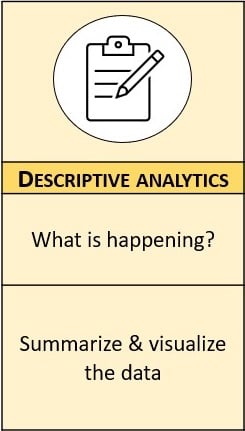
Types of analytics
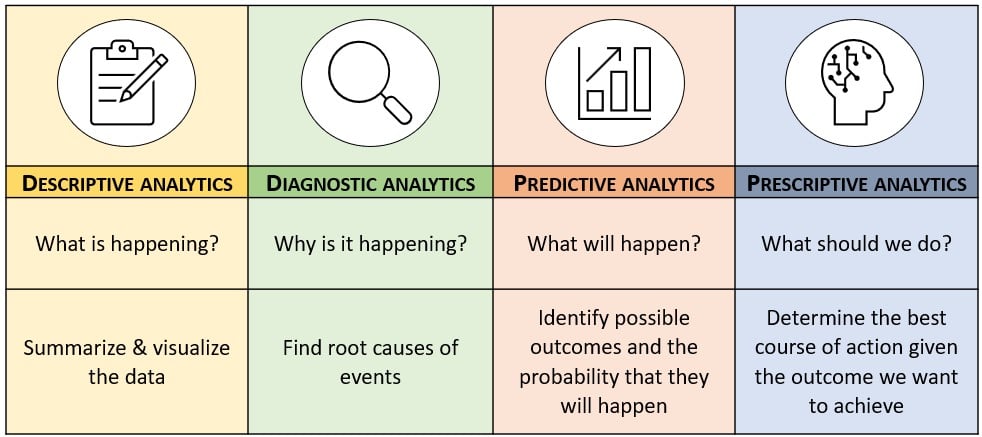
Selecting the right type of analytics
Data Literacy Case Study: Remote Working Analysis
Maarten Van den Broeck
Senior Content Developer at DataCamp

