Visualizing and communicating your insights
Data Literacy Case Study: Remote Working Analysis

Maarten Van den Broeck
Senior Content Developer at DataCamp
A picture tells a thousand words
Things to consider when communicating your insights

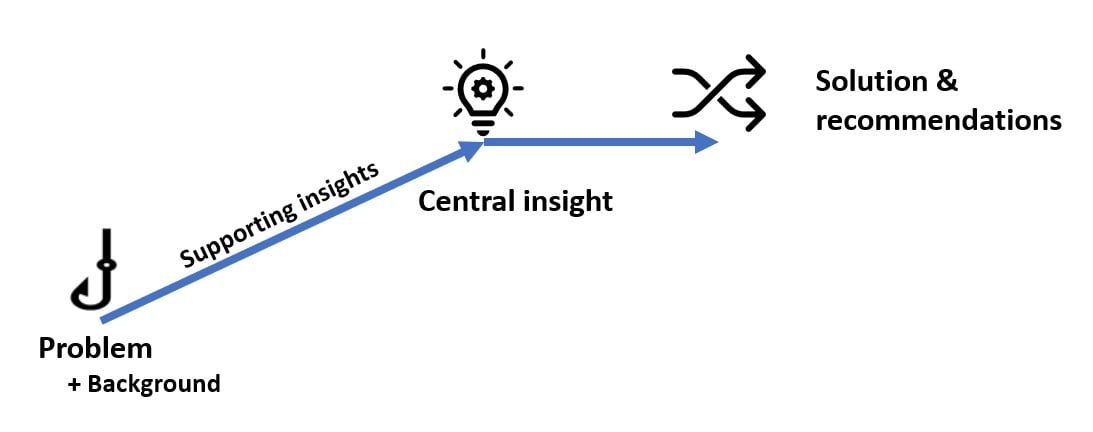
Use a narrative structure
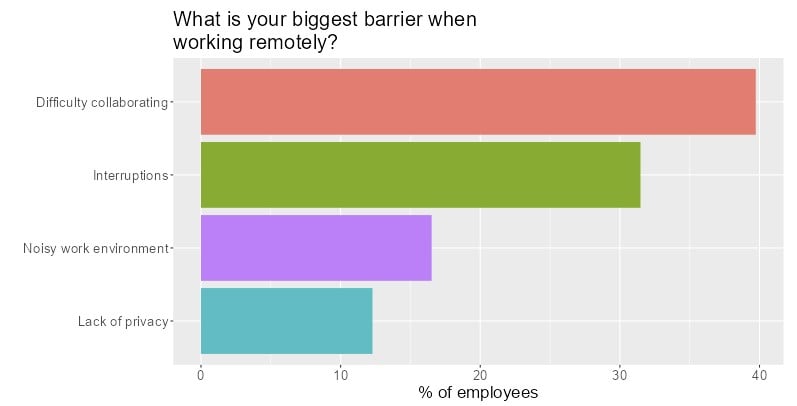
Support insights with visualizations