Exploring the data
Data Literacy Case Study: Remote Working Analysis

Maarten Van den Broeck
Senior Content Developer at DataCamp
Exploratory data analysis

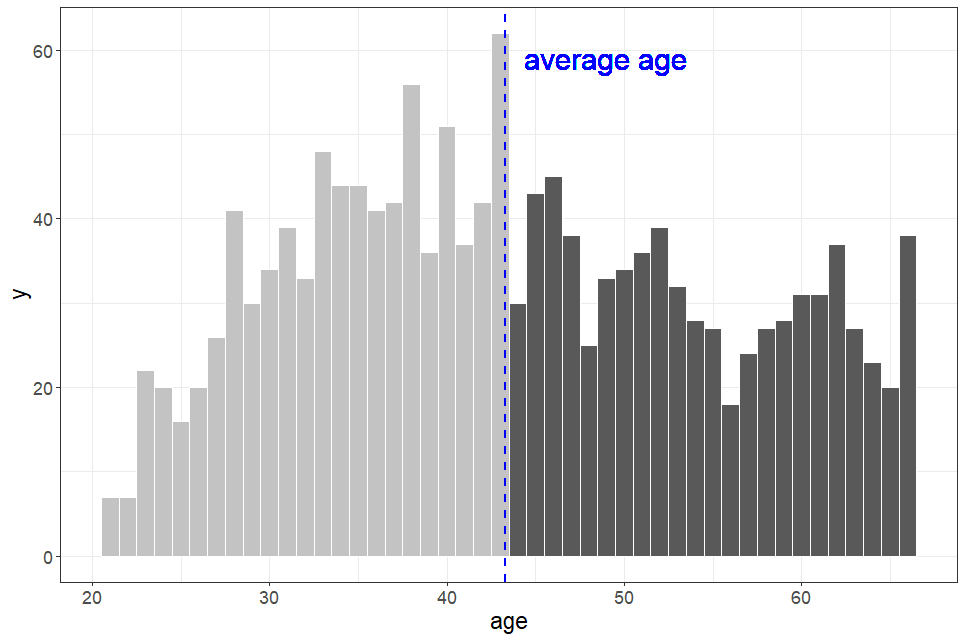
Are all age groups represented?
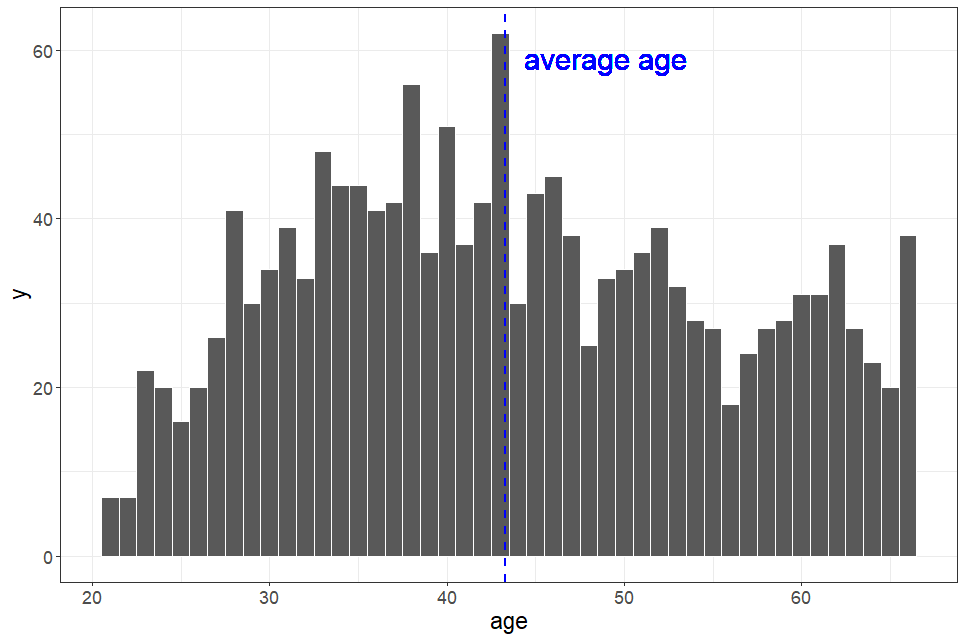
Are all age groups represented?
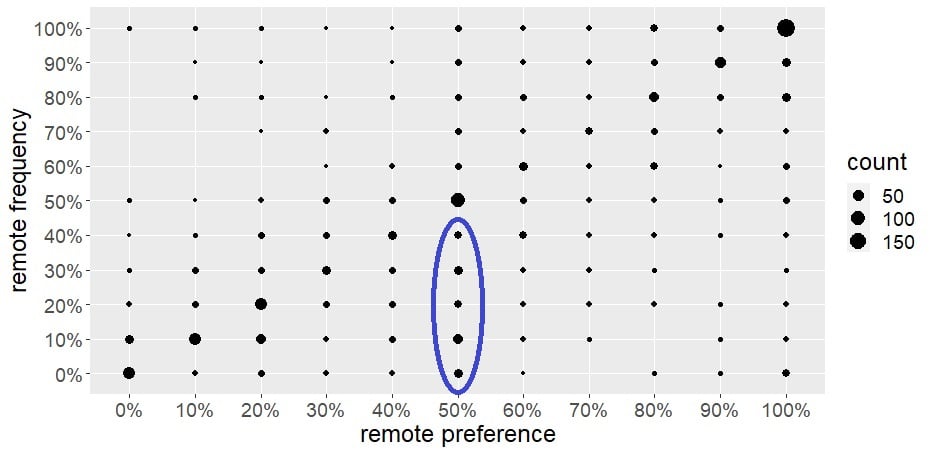
Example: remote frequency vs. preference
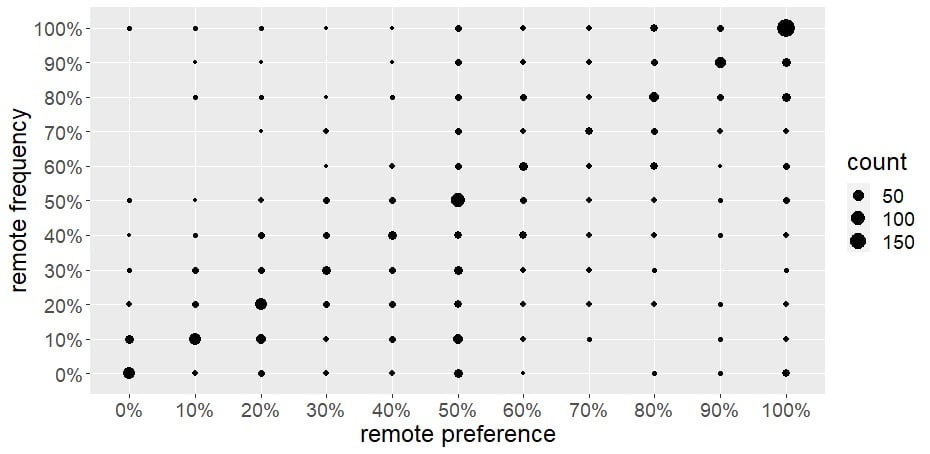
Example: remote frequency vs. preference
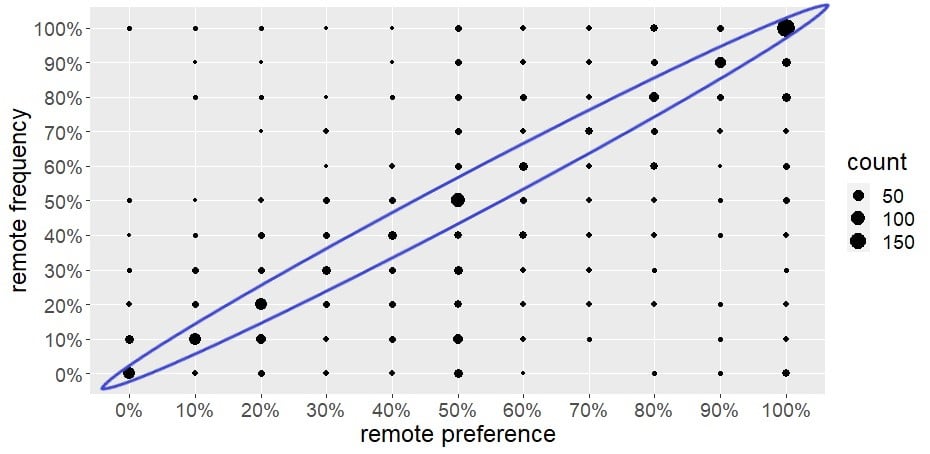
Example: remote frequency vs. preference