Assessing the Make option
Case Study: Supply Chain Analytics in Power BI

Nick Switzer
Analytics Lead
Internal cost estimates
- Buy option uses quotes from suppliers.
Make option uses internal estimates.
Internal estimates need to have enough information for full cost
- Cost per unit is similar to the "quoted cost"

Internal estimate data - Cost per Unit
| Part_Number | Cost_per_Unit | ... |
|---|---|---|
| P1125 | $8.066 | ... |
| P9091 | $4.639 | ... |
| P1227 | $3.22 | ... |
- Cost per unit includes costs for:
- Raw material
- Energy
- Labor
Internal estimate data - equipment data
| Part_Number | Machine Model | Unit Capacity | Existing Capacity | Machine Fixed Cost | ... |
|---|---|---|---|---|---|
| P1125 | 3D Printer79 | 304 | 1472 | $5,000 | |
| P9091 | Lathe23 | 13224 | 29,760 | $1,000,000 | |
| P1227 | 3D Printer79 | 500 | 850 | $5,000 |
- Internal estimates include part specific data:
- Machine model
- Existing capacity
- Cost of a new machine
- If production exceeds capacity, new investment is required.
Incremental equipment costs
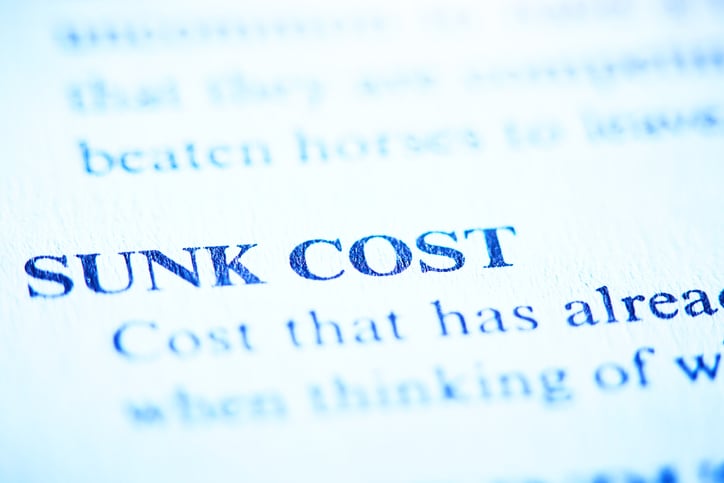
Incremental costs: New costs introduced by our make or buy decision, not sunk costs that exist before the decision.
- Incremental costs are included in the full cost
- Sunk costs are NOT included in the full cost

Pizza example

Incremental Costs (included in decision cost):
- Dough
- Cheese
- Sauce
Sunk Cost (do not include in decision cost):
- Your oven
Pizza party example

Incremental Costs (included in decision cost):
- Lots of dough
- Lots of cheese
- Lots of sauce
- Additional pizza oven
Sunk Cost (do not include in decision cost):
- Your first oven
Other types of incremental make costs

Other incremental costs can include:
- New facilities
- Salaried labor such as engineering, production planners
Calculating investment required
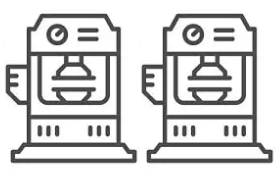
Machines on-hand:

Machines required for production:

Equipment needed formula
Machines required for production:

Machines Required to Purchase = Production Volume - Existing Capacity) / Unit Capacity
Equipment needed formula
Machines required for production:

Machines Required to Purchase = ROUNDUP (Production Volume - Existing Capacity) / Unit Capacity, 0)
Let's practice!
Case Study: Supply Chain Analytics in Power BI

