Scenario Analysis - volume changes
Case Study: Supply Chain Analytics in Power BI

Nick Switzer
Analytics Lead
Deep Thoughts from a Wise Soul
Everyone has a plan until they get punched in the mouth. -Mike Tyson

Sources of uncertainty

- Projects start with assumptions
- Analysis tools should adjust to this uncertainty
- Sources of uncertainty:
- Demand
- Product-market fit
- External economic conditions
- Price
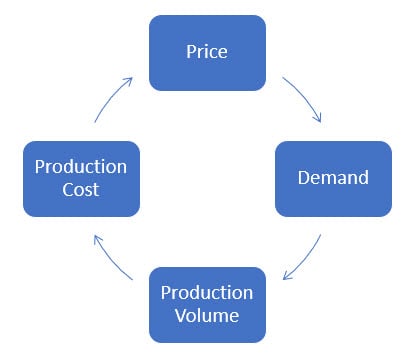
Dependent Relationships

Why not just ask for more quote data?

Quote preparation and ingestion takes:
- Time
- Resources
Building a dynamic scenario analysis tool
| Column name | Description |
|---|---|
| Part_Number | An ID of the Part Number Quoted |
| Supplier | Name of the supplier that submitted the quote |
| Volume | Minimum production volume for the quoted price |
| Unit_Cost | Quoted cost per unit |
| Non_recurring_expenses | One time expenses required for the production volume |
- A scenario volume parameter makes the report dynamic.
- Parameters adds a user-controlled slicer to the report.
Full Cost Measure
| Supplier | Part_Number | Volume | Unit_Cost | Non_recurring_expenses |
|---|---|---|---|---|
| Supplier_XYZ | Part_A | 1000 | $12.90 | $2000 |
| Supplier_XYZ | Part_A | 5000 | $9.78 | $3000 |
| Supplier_MNO | Part_A | 1000 | $5.90 | $6000 |
- Full cost measure must use volume parameter
- Full cost measure will return the lowest full cost from all eligible combinations of:
- Supplier
- Part
- Volume
- Perfect use case for an iterative function
Using an iterative function
MINX(<table>, <expression>) returns the minimum value of an expression computed for each row of the table you pass it.
Function to use
Full Cost (Measure) = MINX(<table>, < expression>)
Measure structure
Full Cost (Measure) = MINX(FILTER(<table>,<filter>), <Full Cost formula>)
Let's practice!
Case Study: Supply Chain Analytics in Power BI

