College major outcomes analysis
Data Storytelling Case Study: College Majors

Leondra R. Gonzalez
Sr. Data & Applied Scientist, Microsoft
College statistics in 2021

1 College Enrollment and Work Activity of Recent High School and College Graduates Summary. (April, 2022). Retrieved from https://www.bls.gov/news.release/hsgec.nr0.htm.
The case

1 College Enrollment and Work Activity of Recent High School and College Graduates Summary. (April, 2022). Retrieved from https://www.bls.gov/news.release/hsgec.nr0.htm.
The data
The audience

The requirements

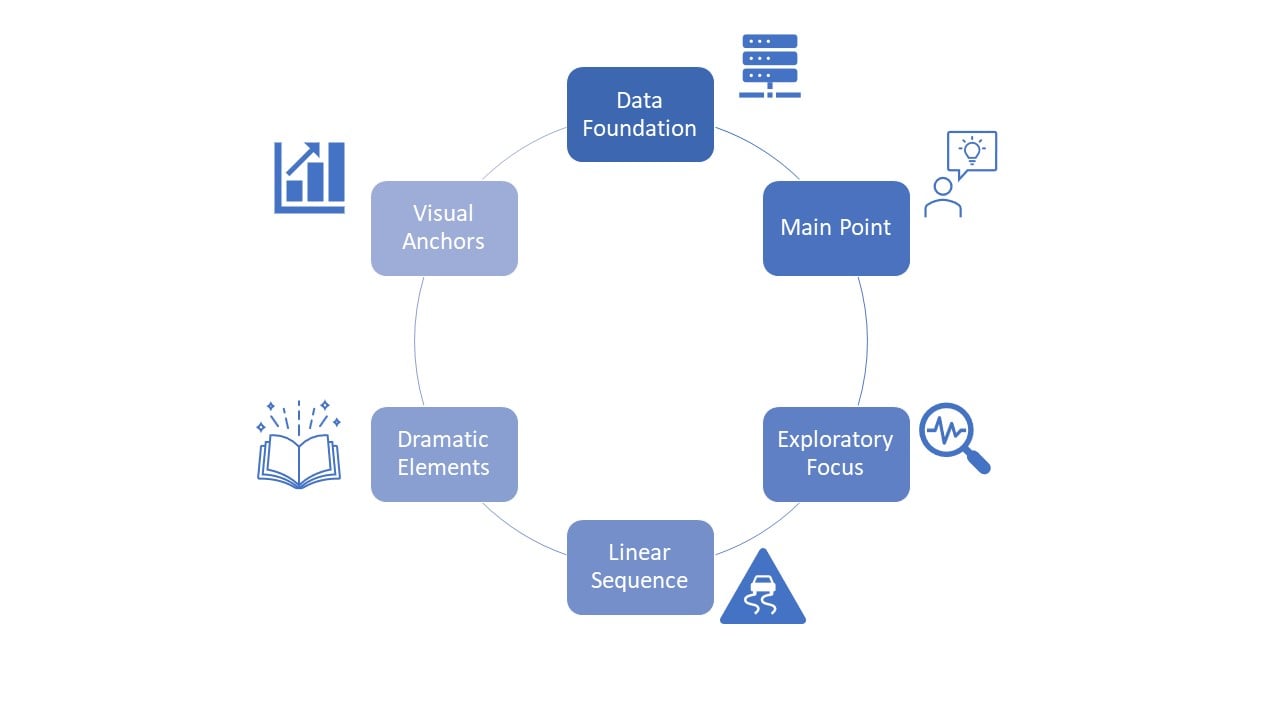
Getting organized