Best practices

Data Storytelling Case Study: Green Businesses

Camilo Martínez Burgos

Data analysis and public policy consultant

Simplicity and clarity

  • Reduce complexity
  • Use clear language
  • Minimize non-data ink

Bad excel charts

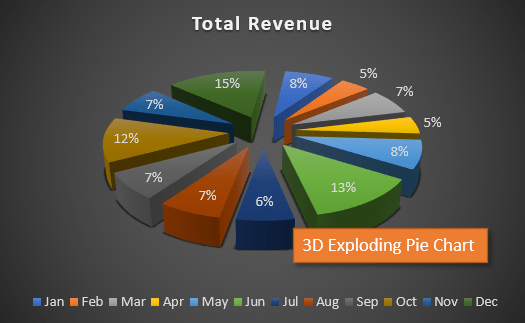
1 https://www.excelcampus.com/charts/5-bad-charts/
Data Storytelling Case Study: Green Businesses

Labeling axes and providing a clear title
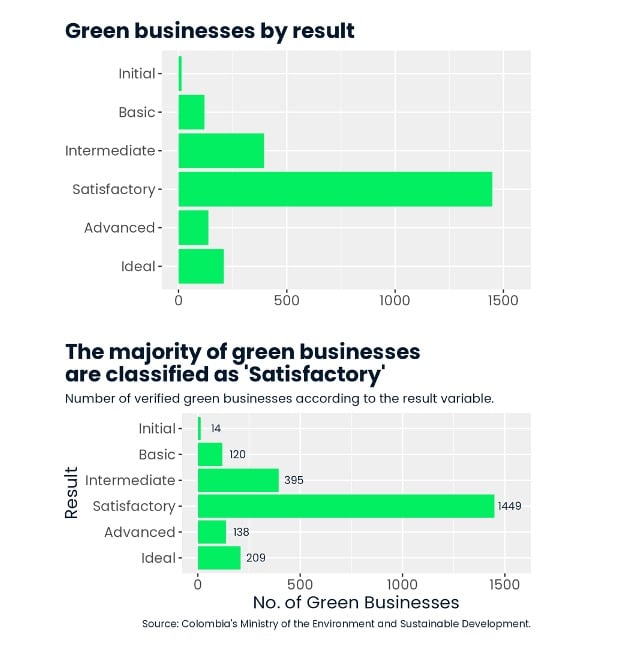
  • Label the axes
  • Provide a clear title
  • Use descriptive axis labels
  • Employ descriptive subtitles

Labels example

Data Storytelling Case Study: Green Businesses

Be consistent

  • Use consistent formatting throughout your visualizations
  • Use a consistent color scheme
  • Use the same type of chart for similar types of data

Sample plot with other theme

Data Storytelling Case Study: Green Businesses

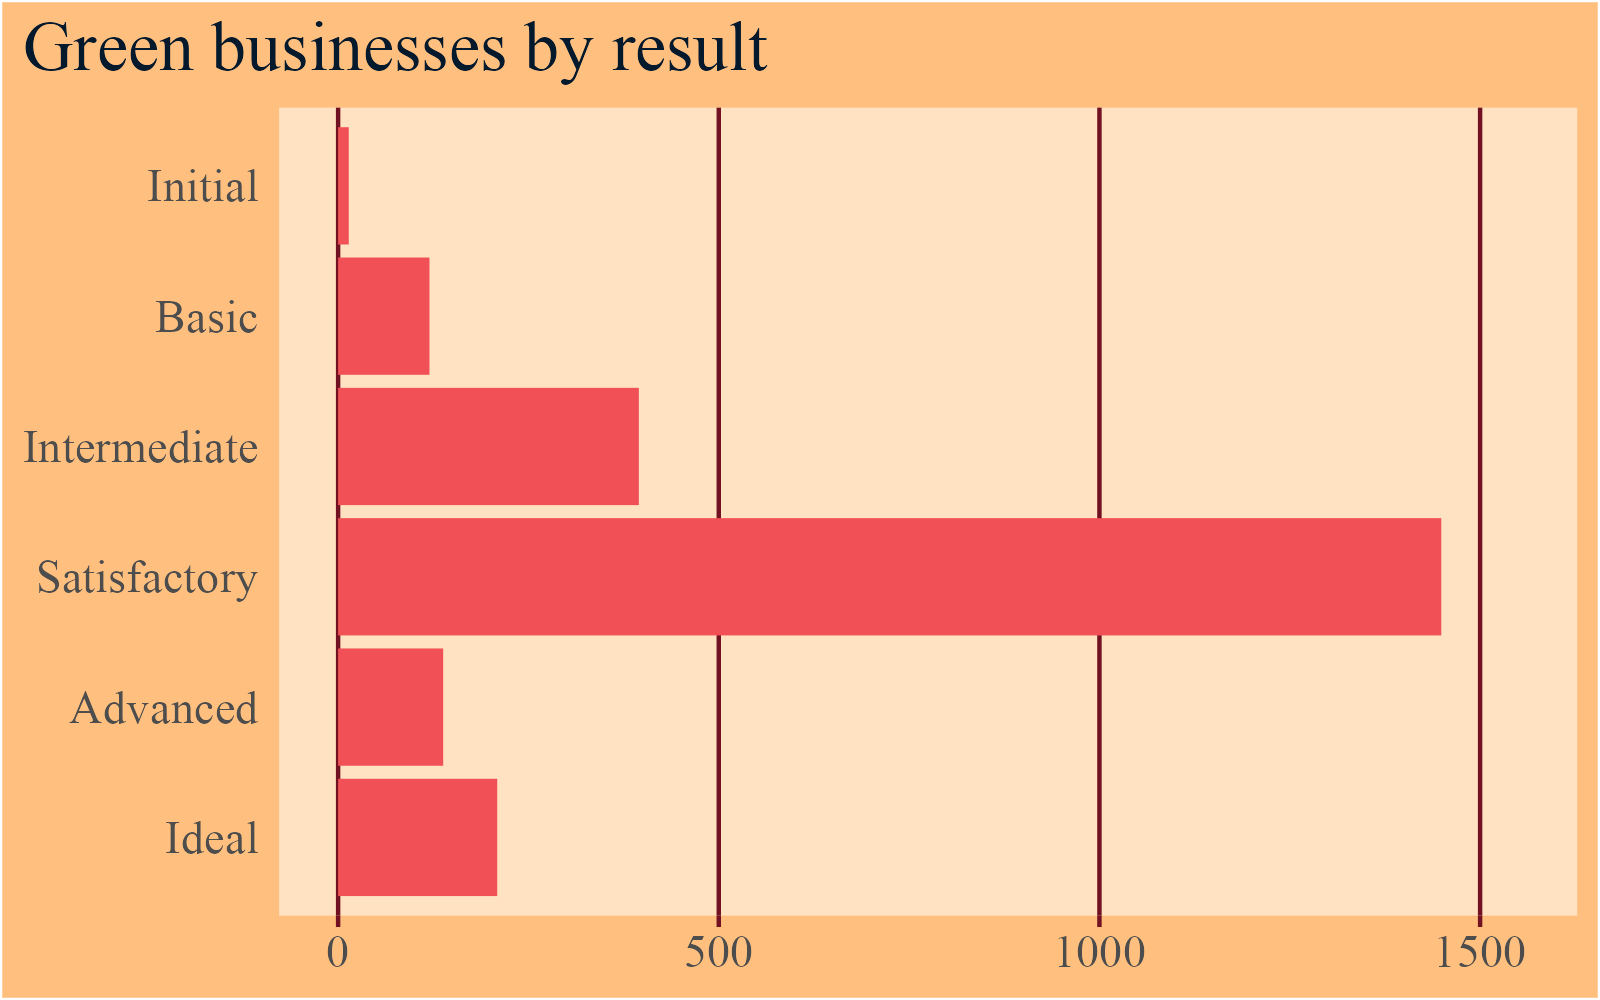
Accessibility matters

  • Accessibility is important in data storytelling
  • Provide alt text for images and graphs for screen readers
  • Take colorblindness into account

Alt text illustration

Data Storytelling Case Study: Green Businesses

Let's practice!

Data Storytelling Case Study: Green Businesses

Preparing Video For Download...