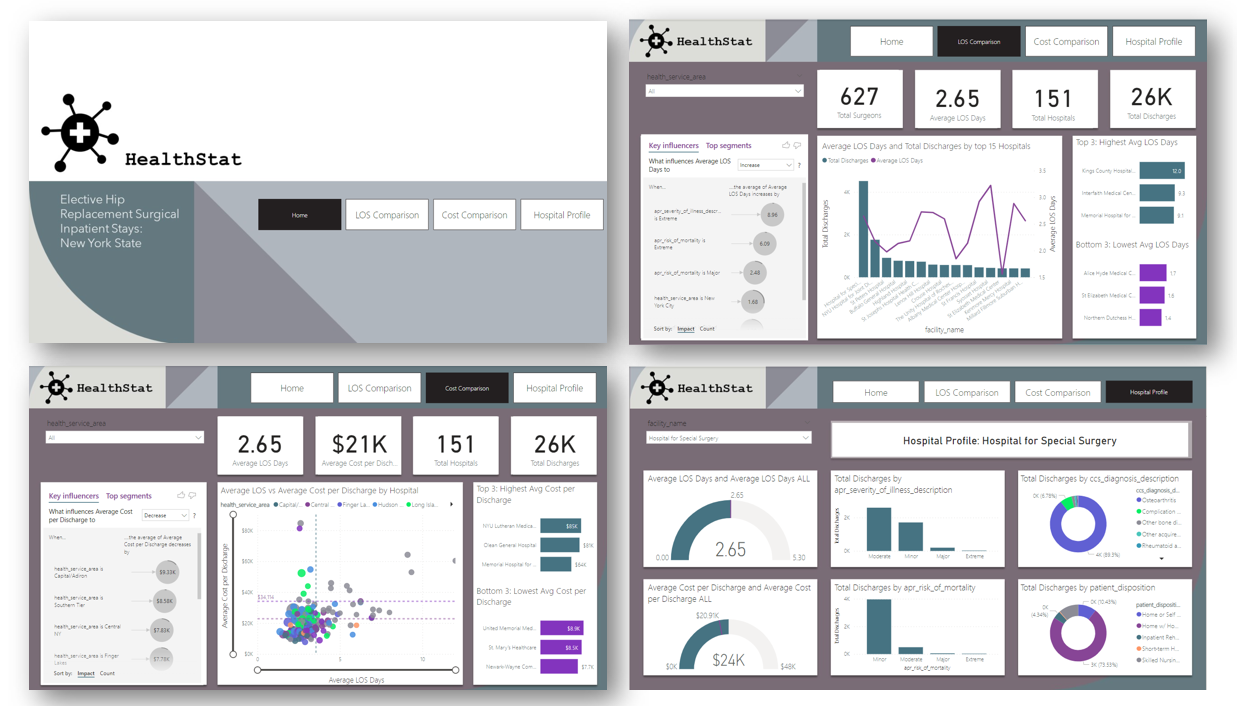
Creating a dynamic dashboard

Case Study: Analyzing Healthcare Data in Power BI

Lyndsay Girard

Healthcare Analytics Consultant

Measuring hospital efficiency

Institute of Medicine (IOM) quality framework listing the six domains of healthcare quality, with Efficiency domain highlighted

  • Average LOS days
  • Average cost per discharge
Case Study: Analyzing Healthcare Data in Power BI

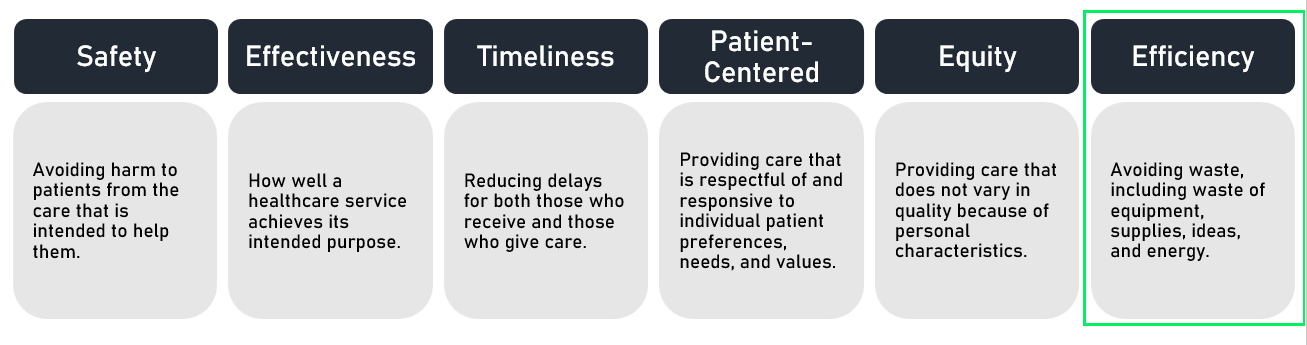
Key insights uncovered

Illustration of hospital and person with arrows connecting them into a circle

  • Average cost per discharge was $20,910
  • Top influencers increasing average LOS and cost:
    • Extreme illness severity
    • Extreme/ Major mortality risk
    • Hospitals in New York City
    • Patient disposition to skilled nursing home
Case Study: Analyzing Healthcare Data in Power BI

The final product

Image of 4 dashboard pages composed together

Case Study: Analyzing Healthcare Data in Power BI

Let's practice!

Case Study: Analyzing Healthcare Data in Power BI

Preparing Video For Download...