Exploratory Data Analysis
End-to-End Machine Learning

Joshua Stapleton
Machine Learning Engineer
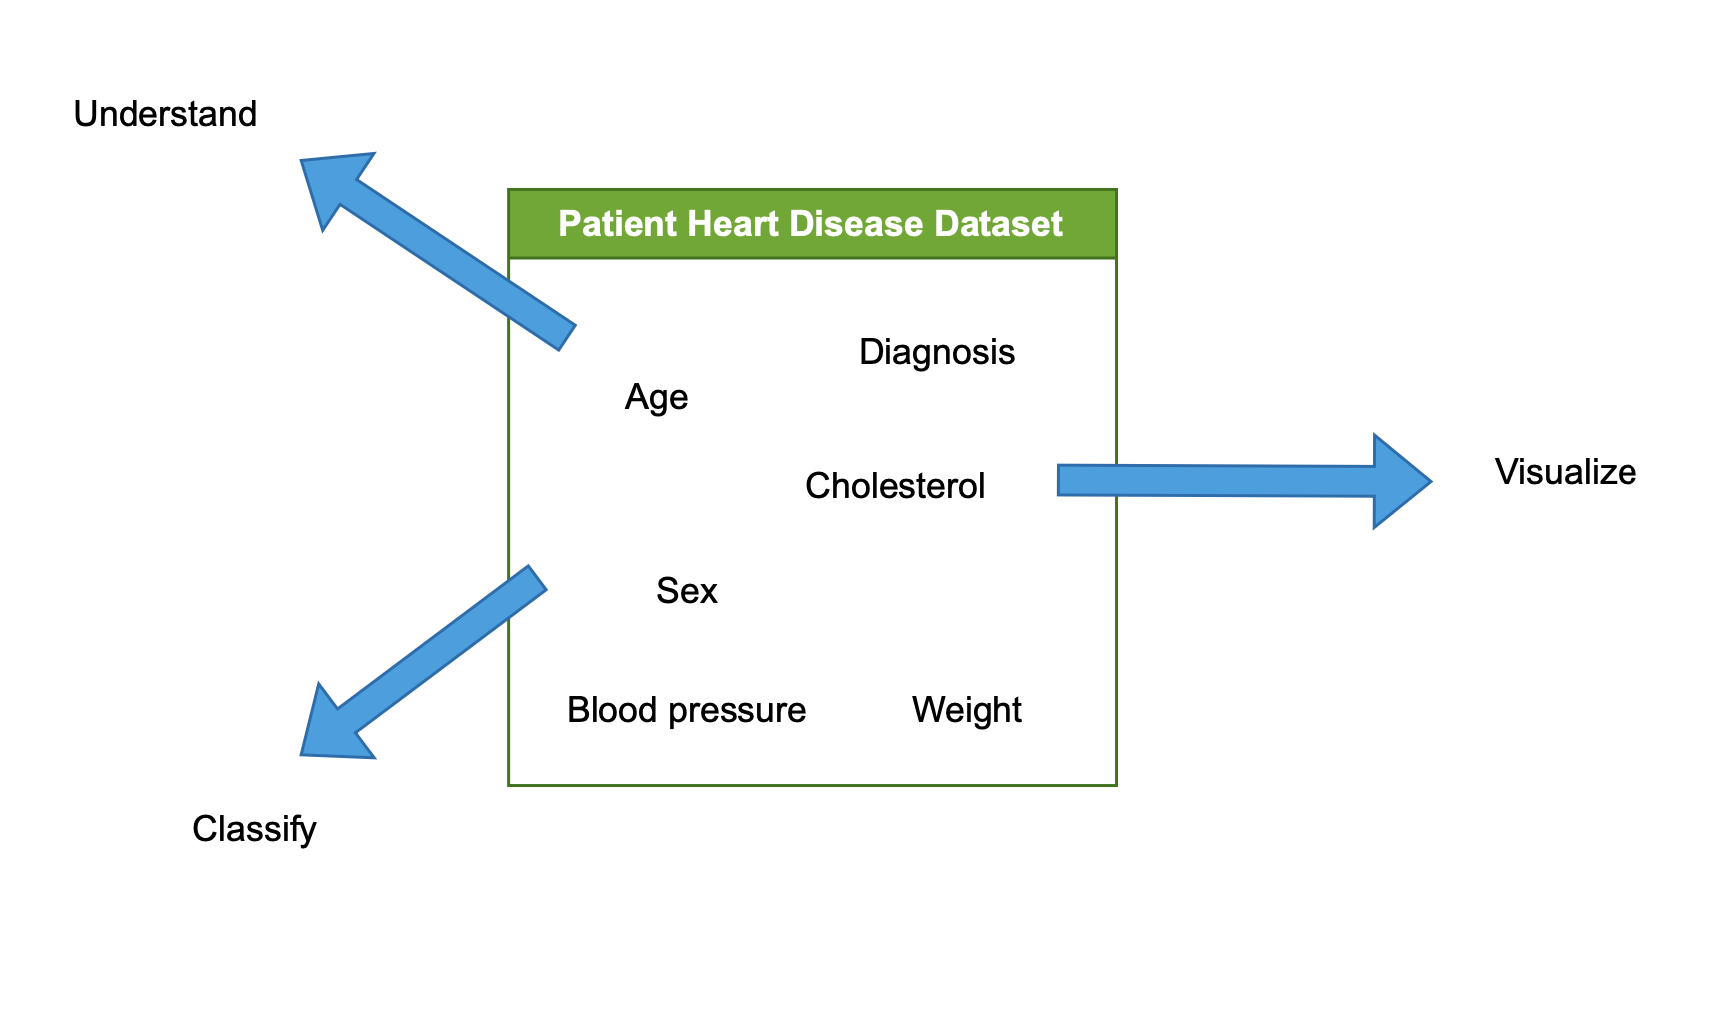
The EDA process
- Examine and analyse the dataset
- Understand the dataset
- Visualize the dataset
- Characterize / classify the dataset
Understanding our data
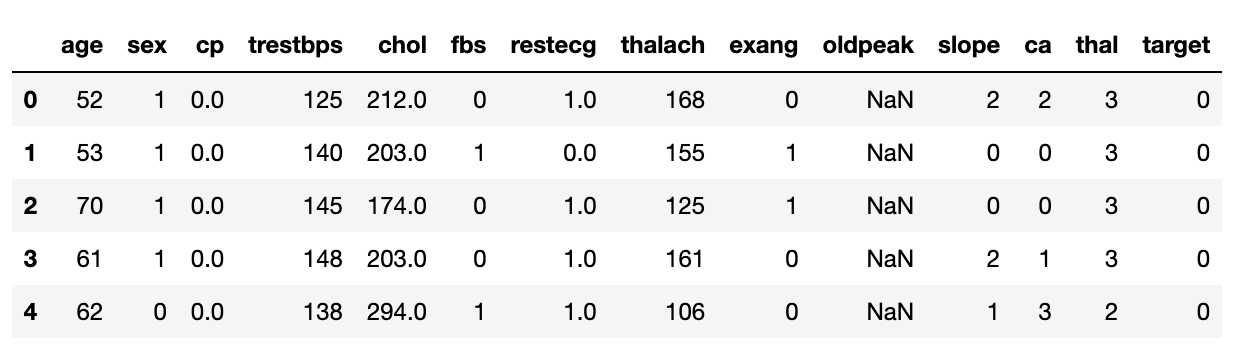
df.head()
- Shows first rows of the dataset
- Provides snapshot of data's structure
# Print the first 5 rows
print(heart_disease_df.head())
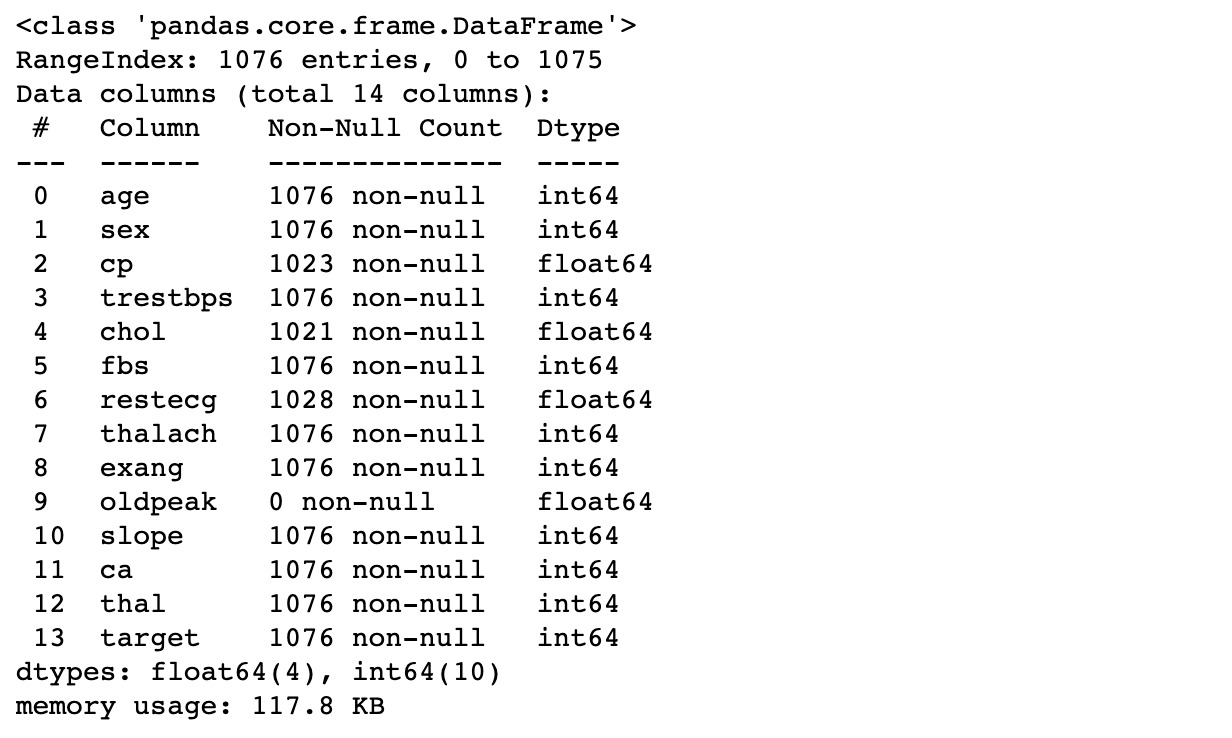
df.info()
- Summarizes features
- Shows non-null entries and feature types
# Print out details
print(heart_disease_df.info())
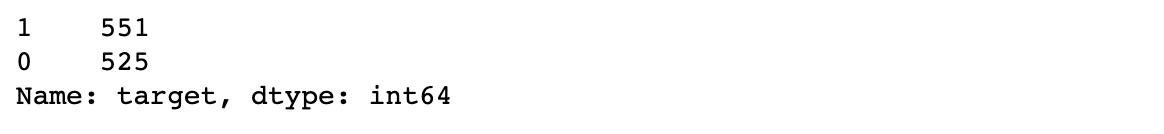
Class (im)balance
df.value_counts()
- Counts number of unique occurrences of each class
- Class: binary presence of heart disease (1/0)
- Important for modeling
# print the class balance
print(heart_disease_df['target'].value_counts(normalize=True))
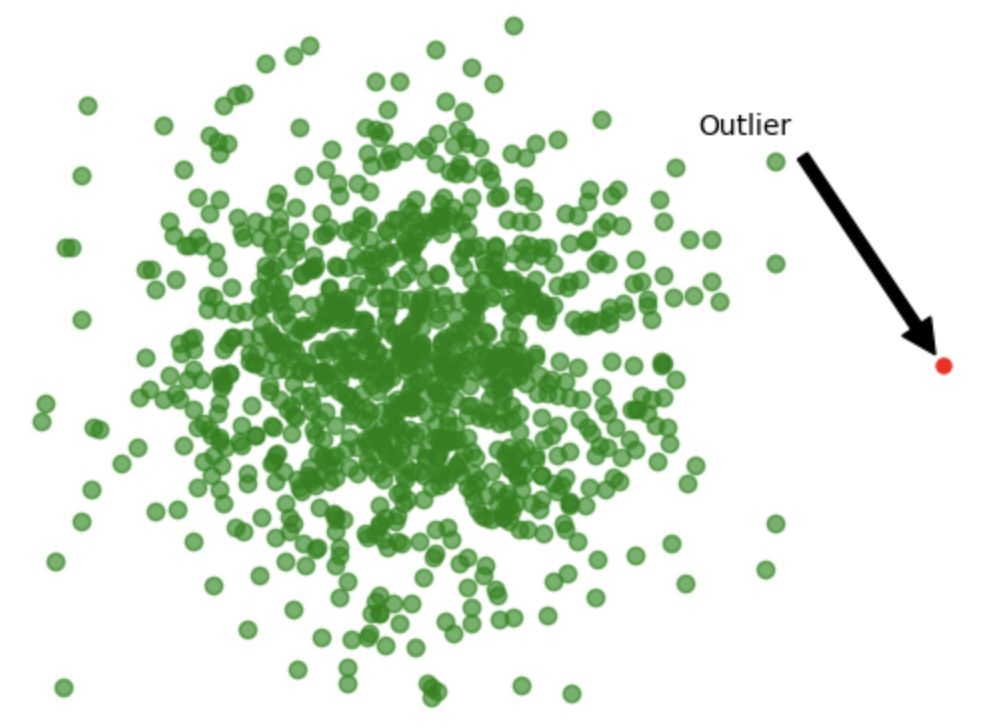
Outliers
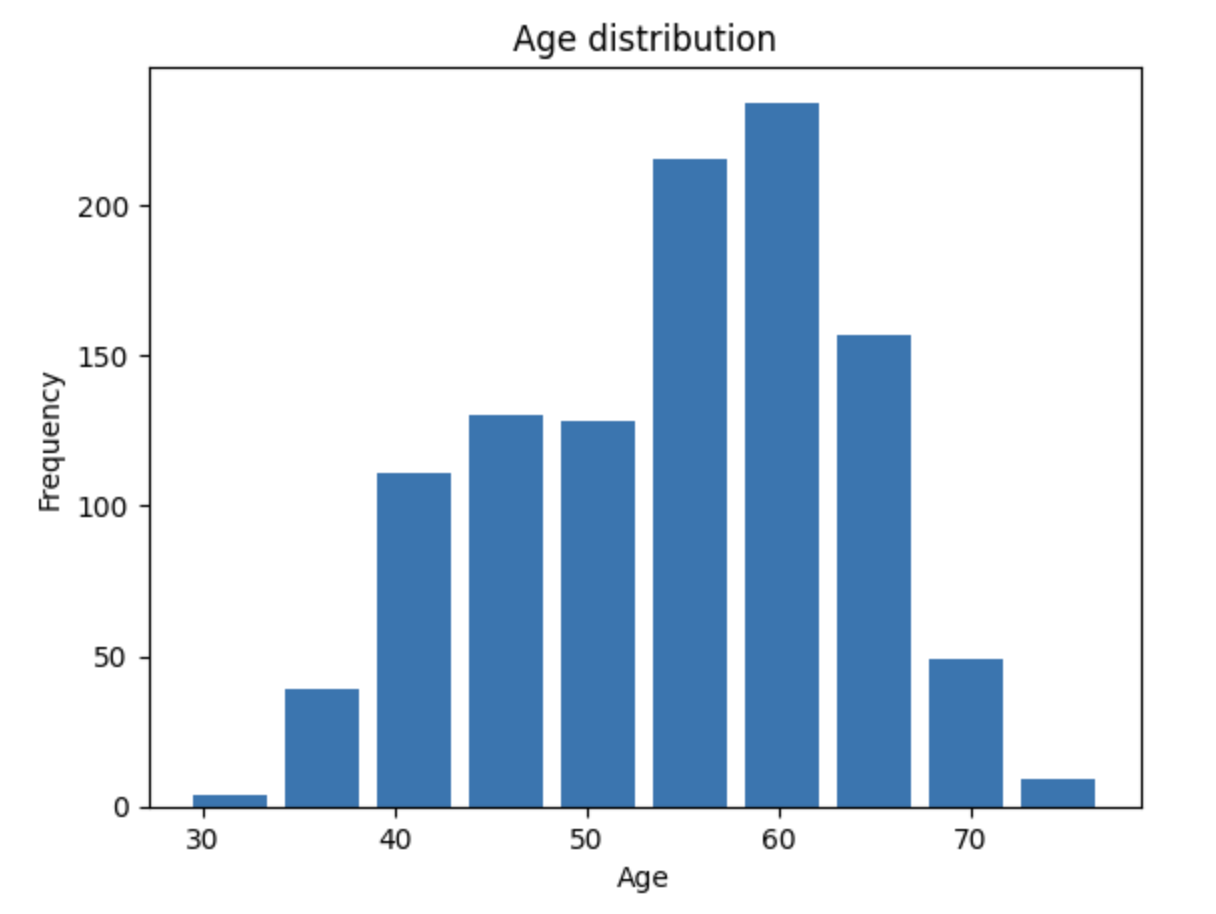
Visualizing our data
df['age'].plot(kind='hist')
plt.xlabel('Age')
plt.ylabel('Frequency')
plt.show()
1 https://seaborn.pydata.org/tutorial/distributions.html, https://app.datacamp.com/learn/courses/intermediate-data-visualization-with-seaborn

