Congratulations!
Time Series Analysis in Tableau

Chris Hui
VP, Tracked
What you've learned: chapter one
- What times series data is
- Continuous and discrete time series
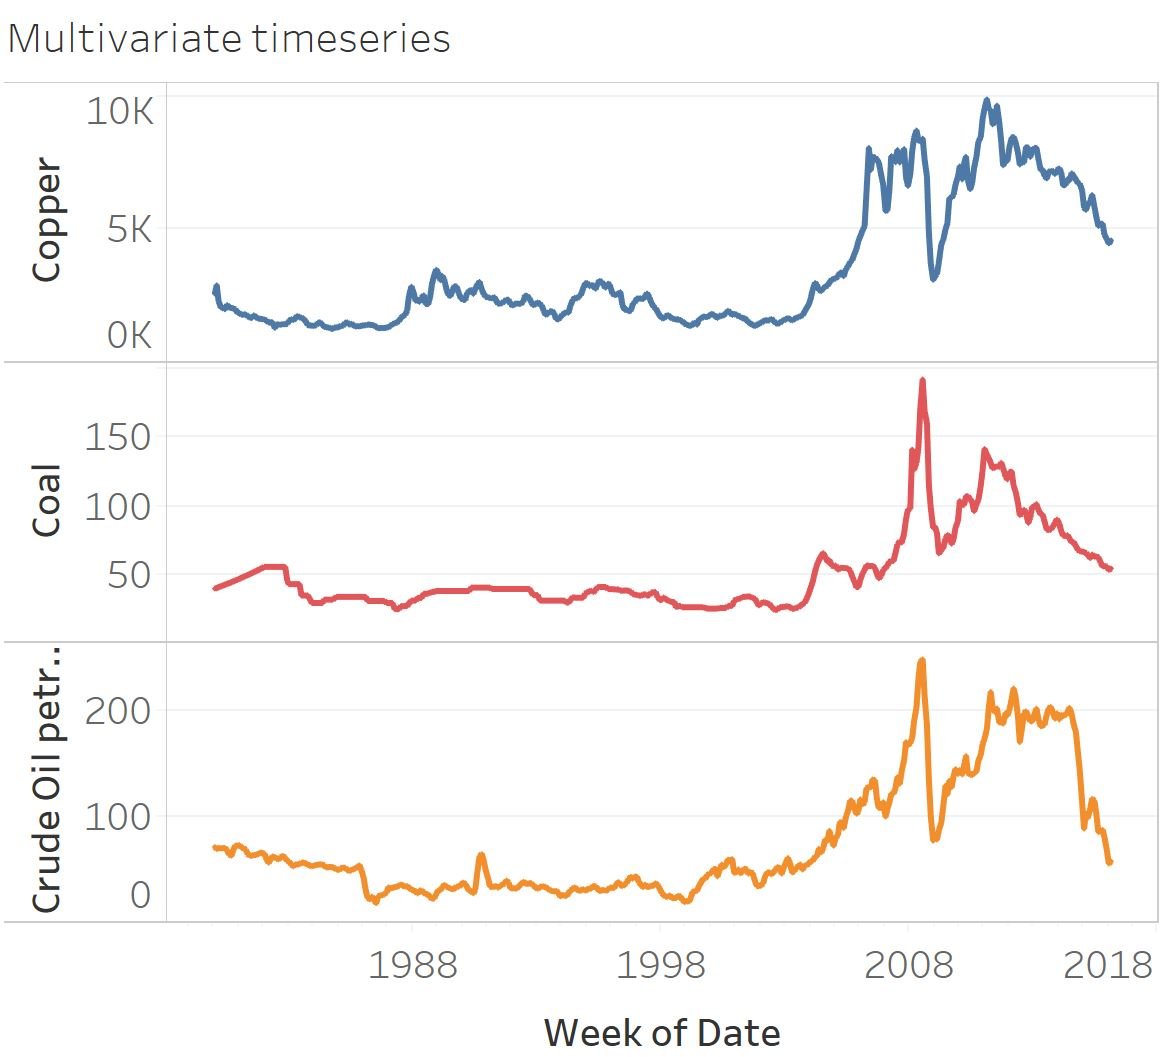
- Univariate and multivariate analysis
- Data granularity
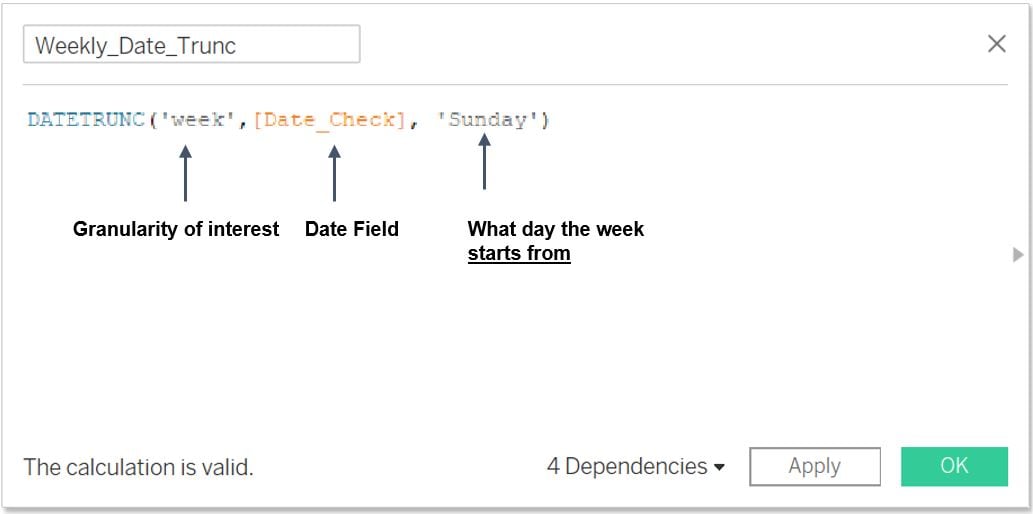
- Reforming and truncating date time stamps
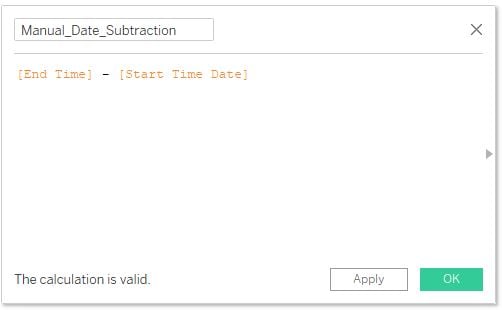
- Calculated fields with dates
What you've learned: chapter two
- Date parsing
- Splitting up dates
- Date time stamp validation
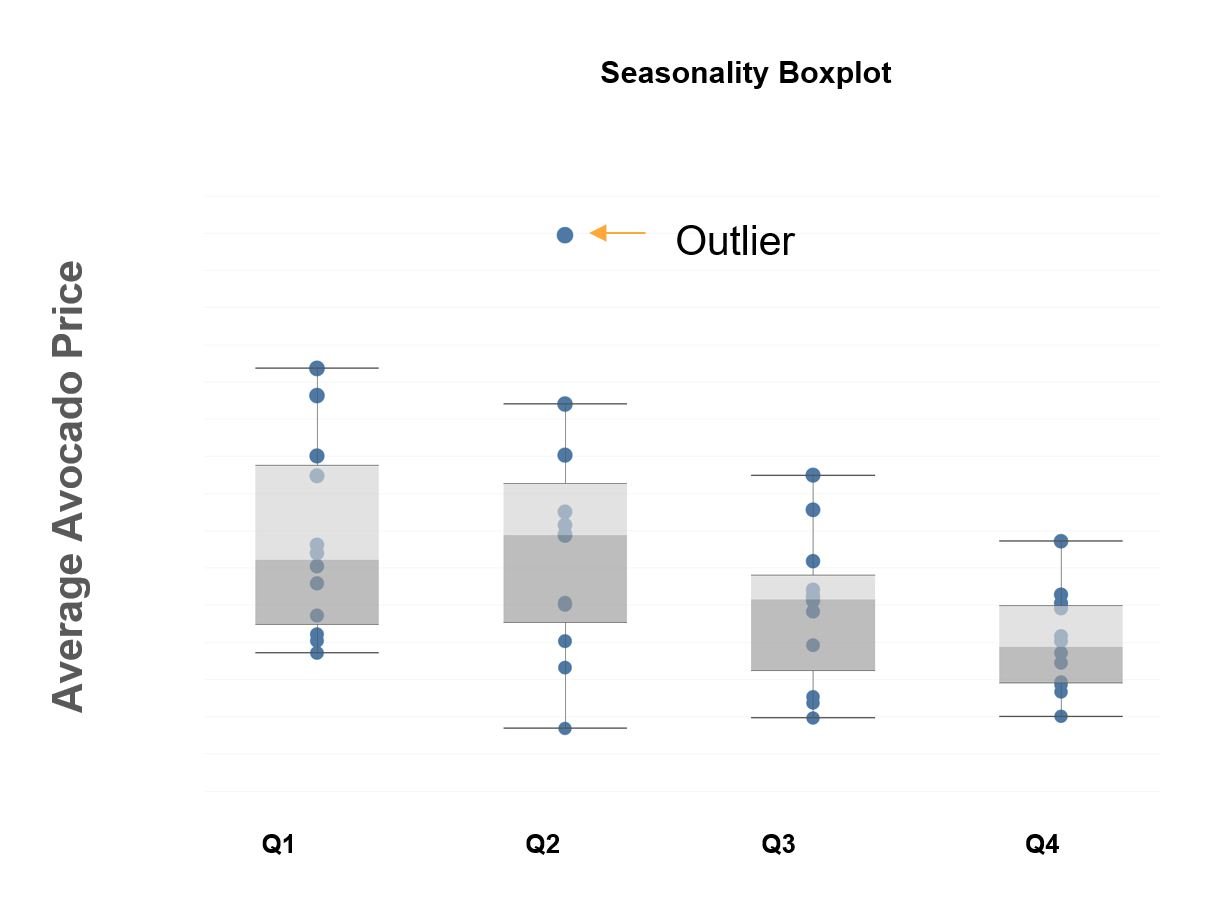
- Seasonality
- Moving averages
- Box plots
- Percentiles
What you've learned: chapter three
- Windows
- Window sizes
- Window functions
- Rolling standard deviations
- Upper and lower boundaries
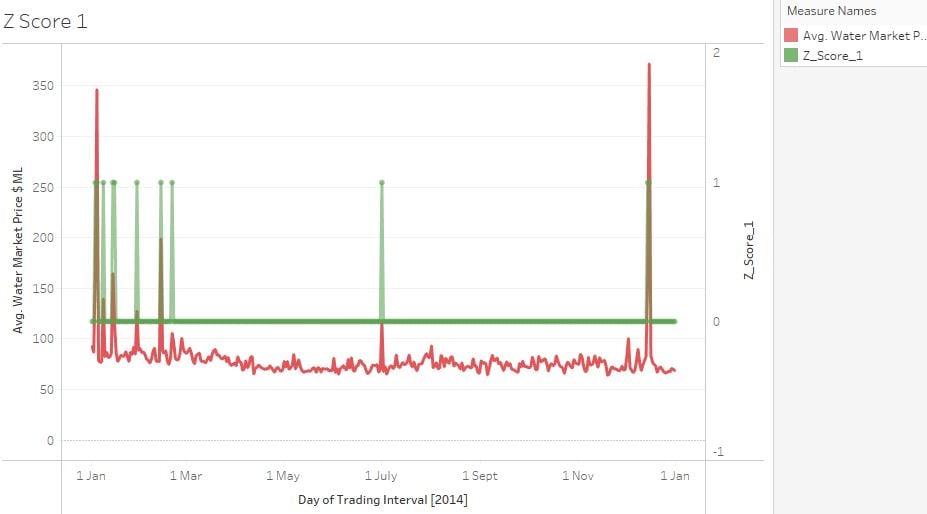
- Z-scores and anomaly detection
Thank you!
Time Series Analysis in Tableau
