Date transformations and visualizations
Time Series Analysis in Tableau

Chris Hui
VP, Tracked
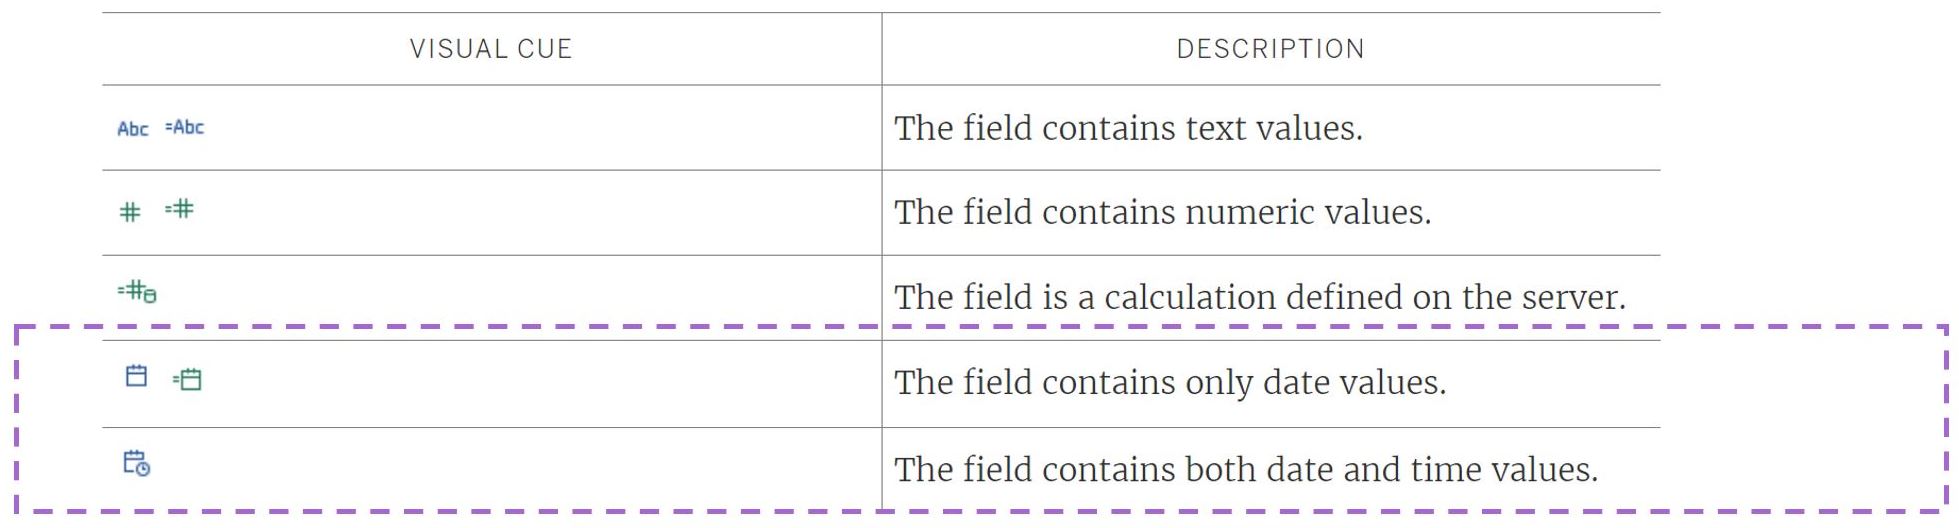
Date time specific data types
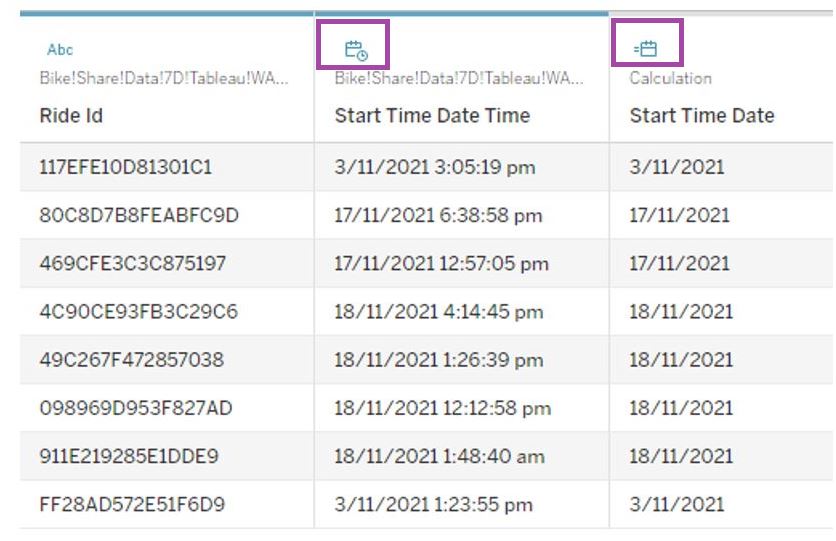
Date time data models
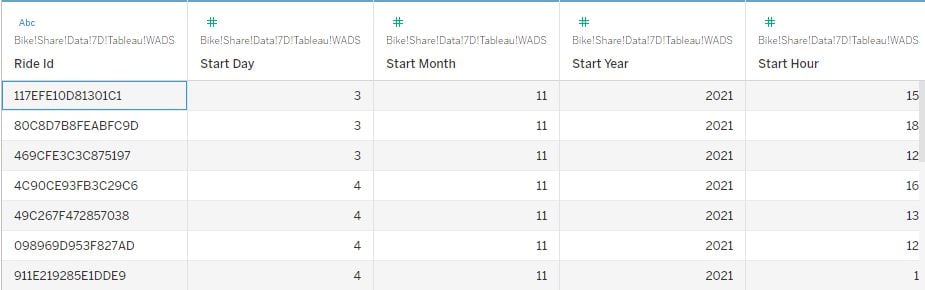
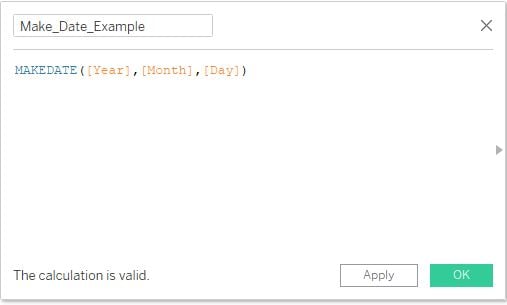
Making dates in Tableau
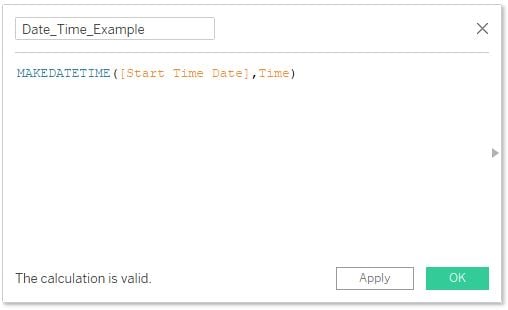
Making time in Tableau
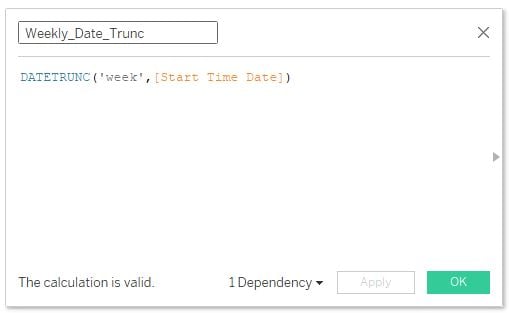
Date truncation in Tableau
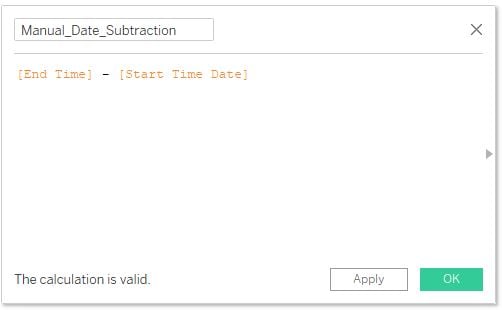
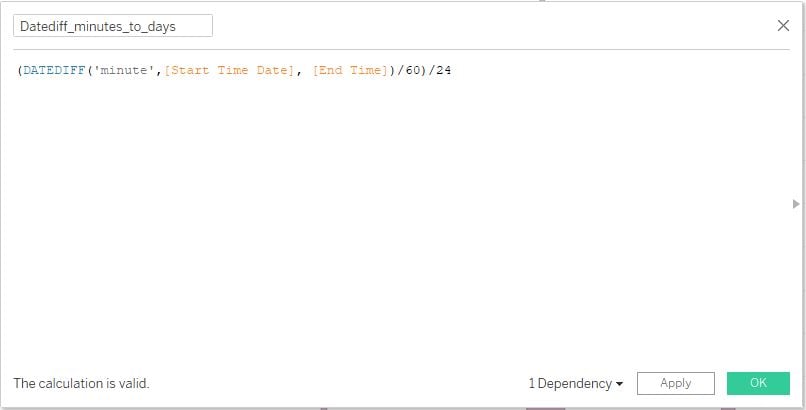
Calculations between date timestamps
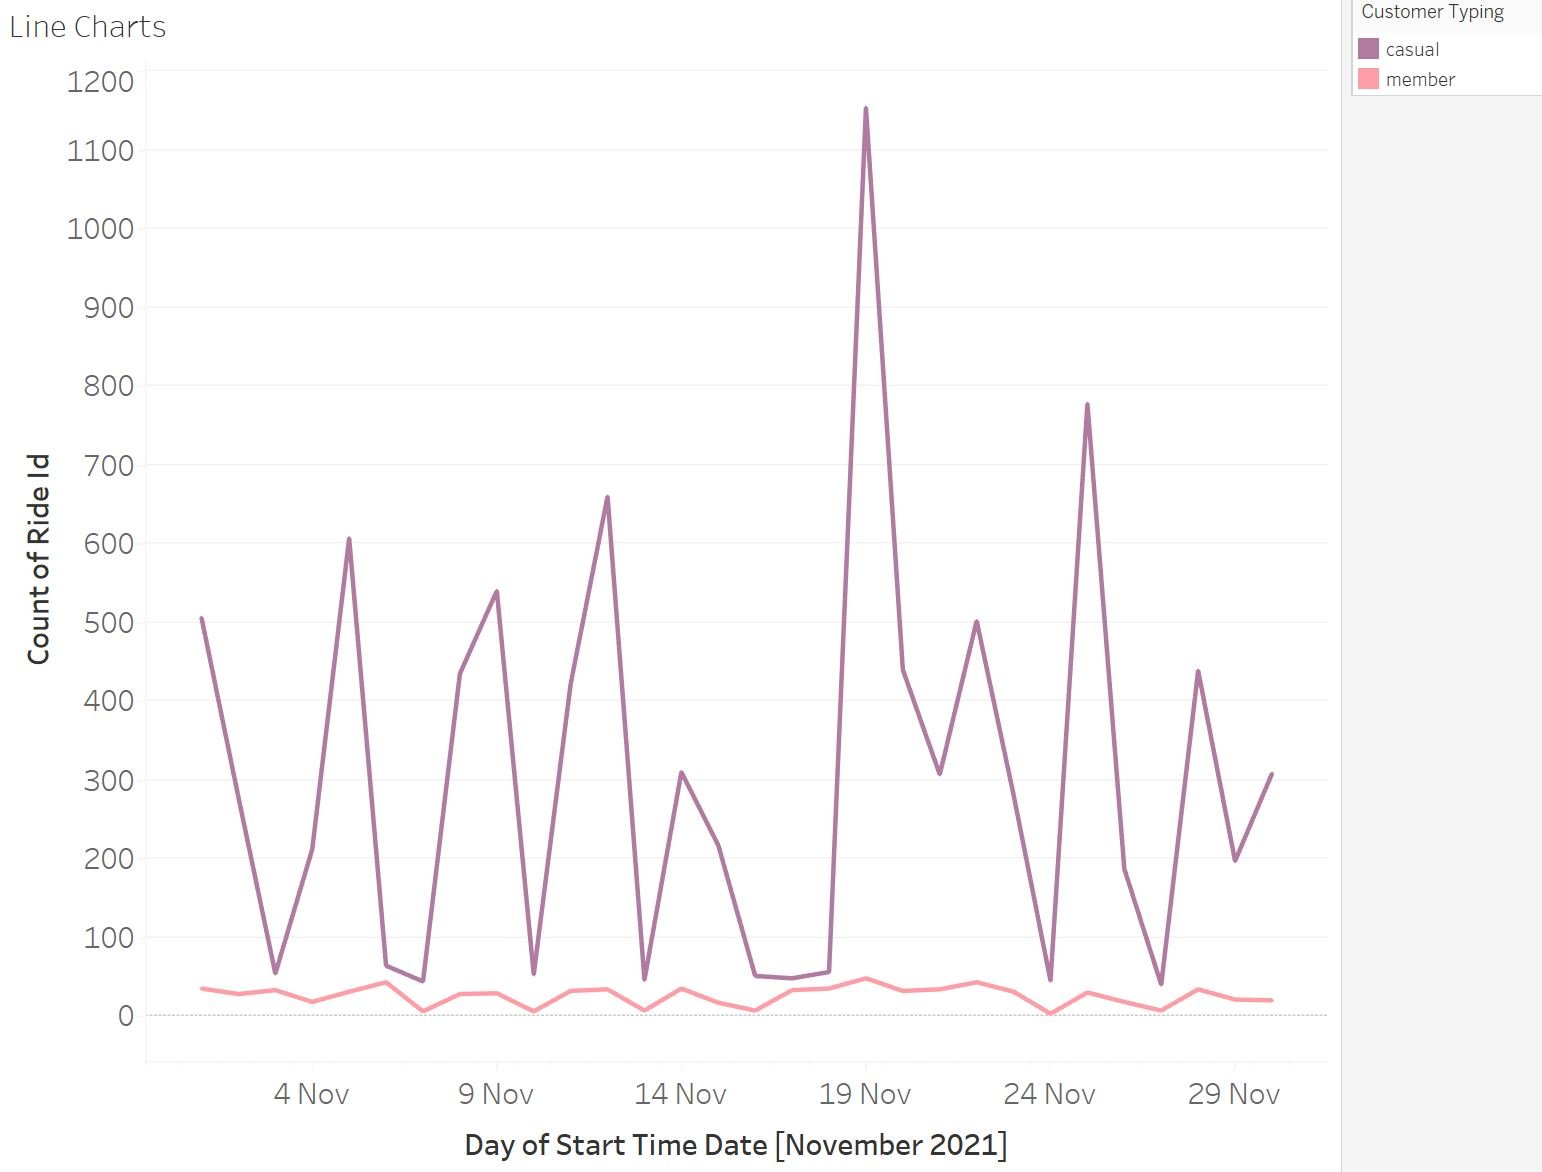
Visualizations with time series
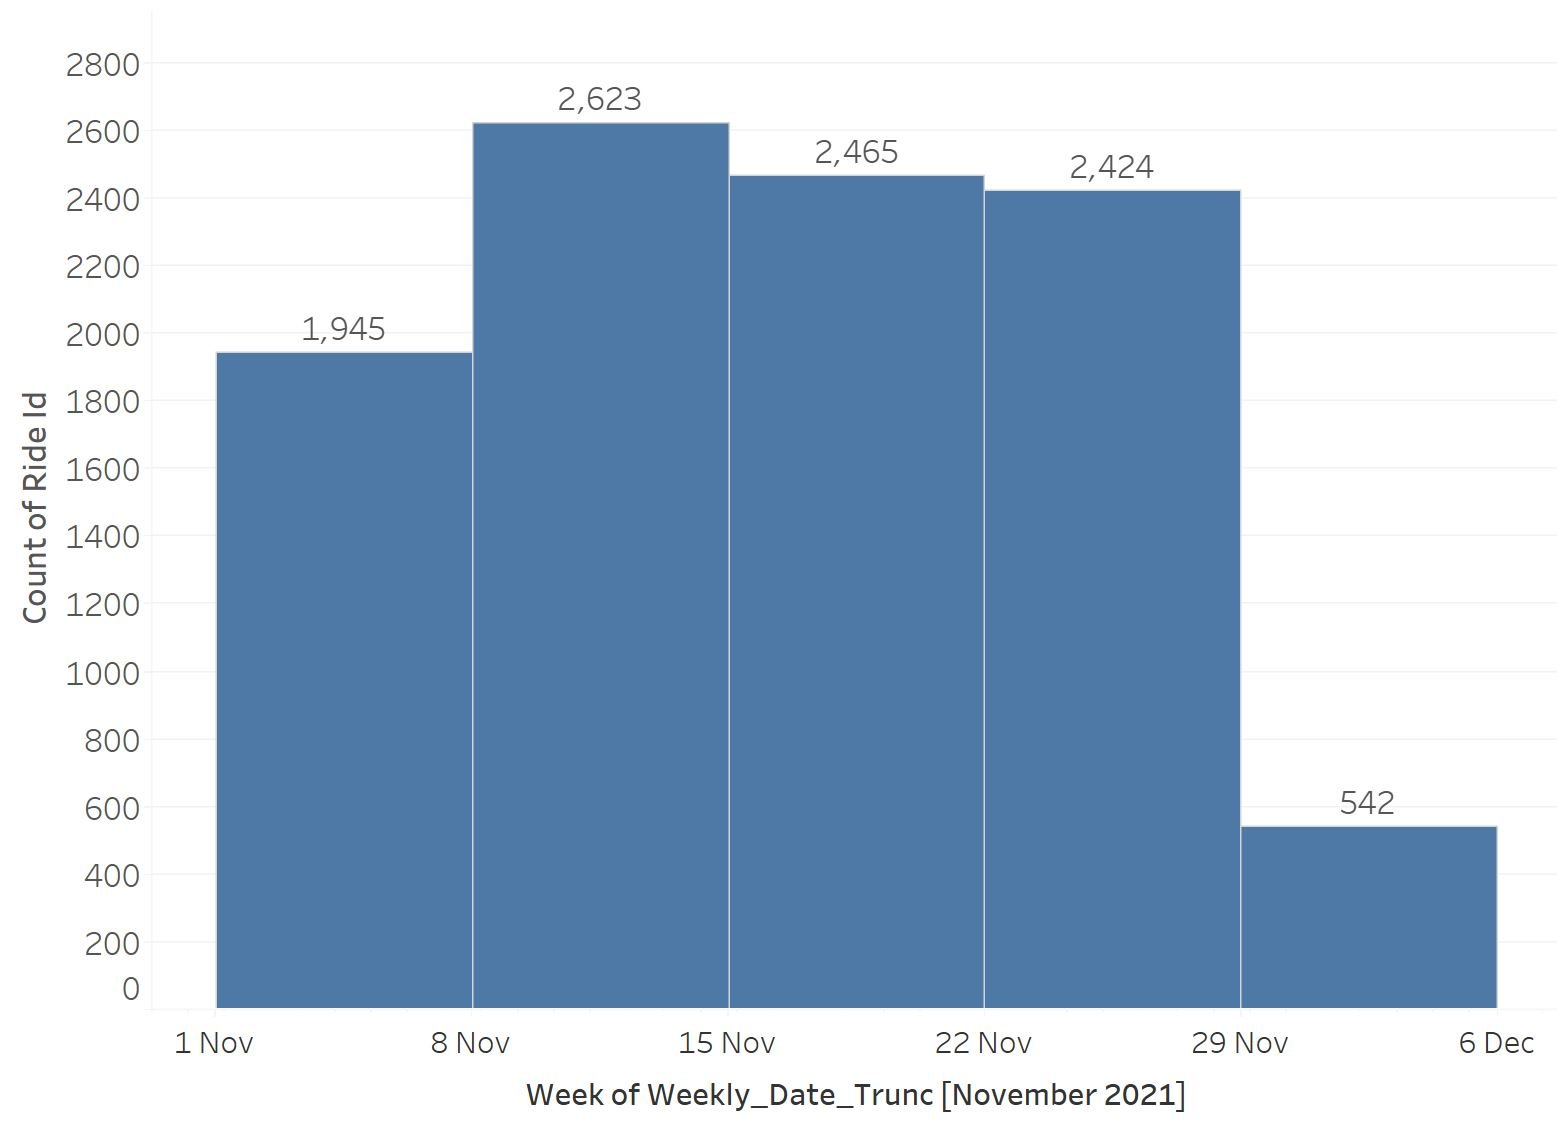
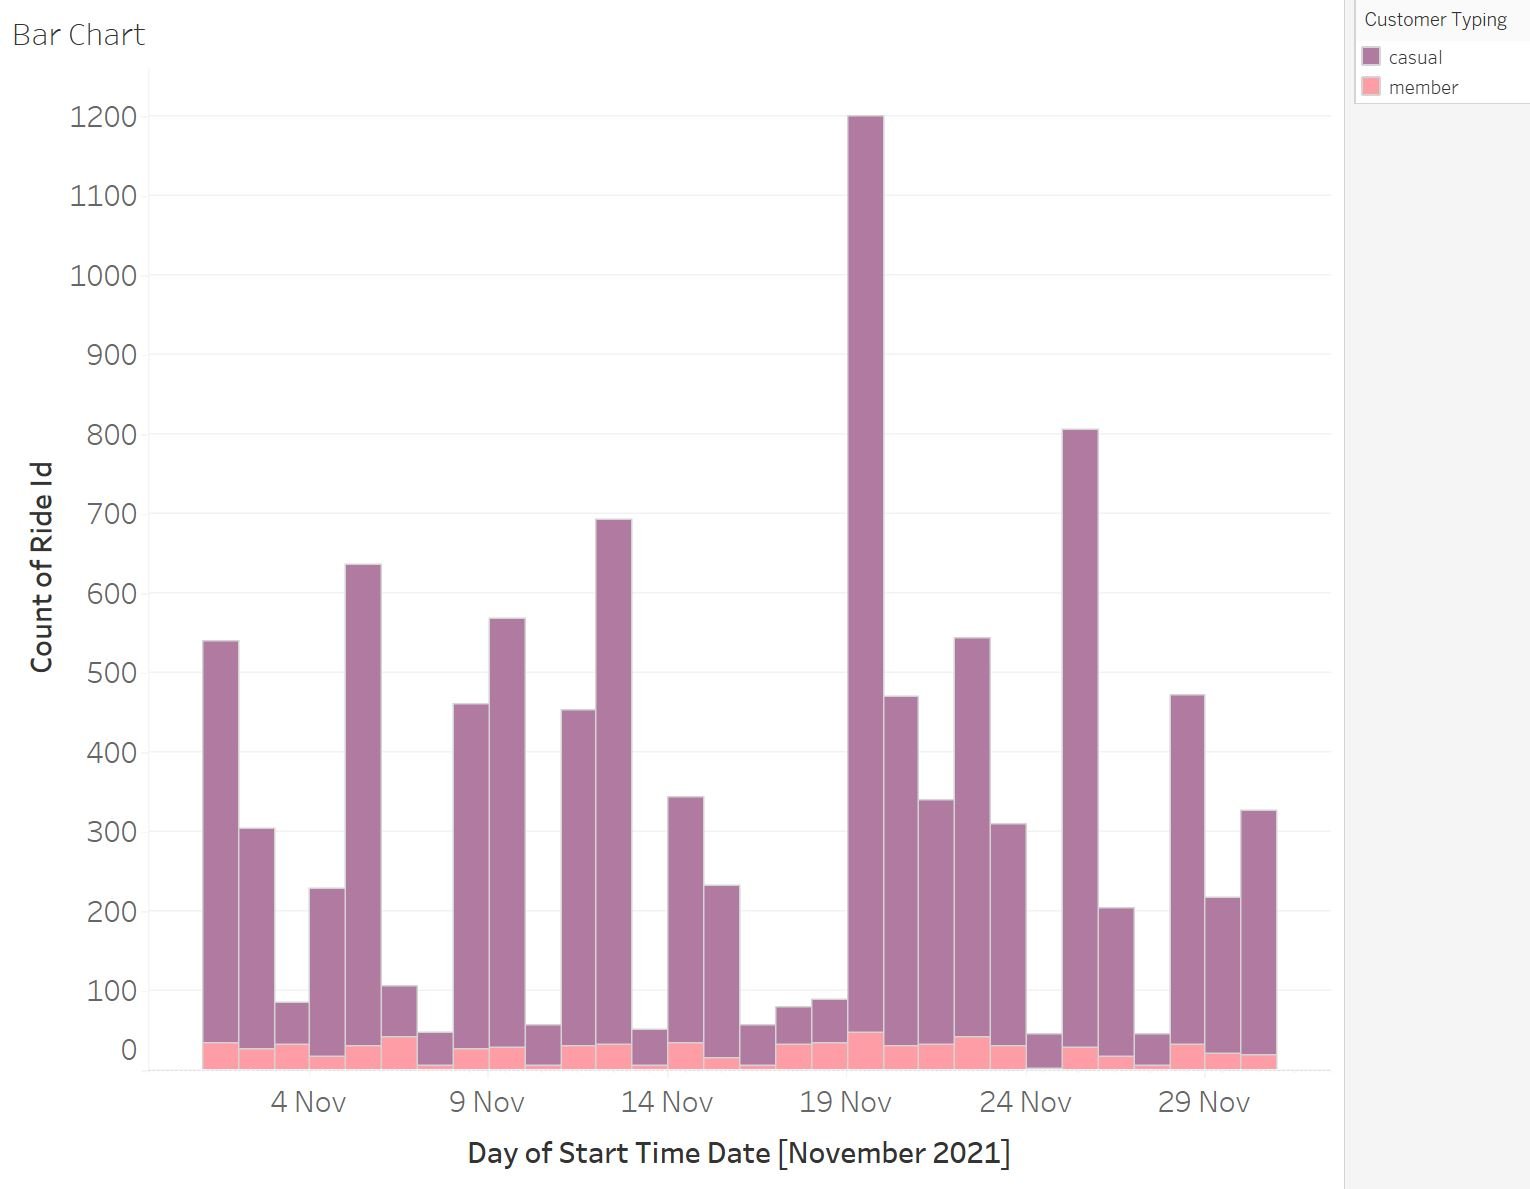
Bar charts
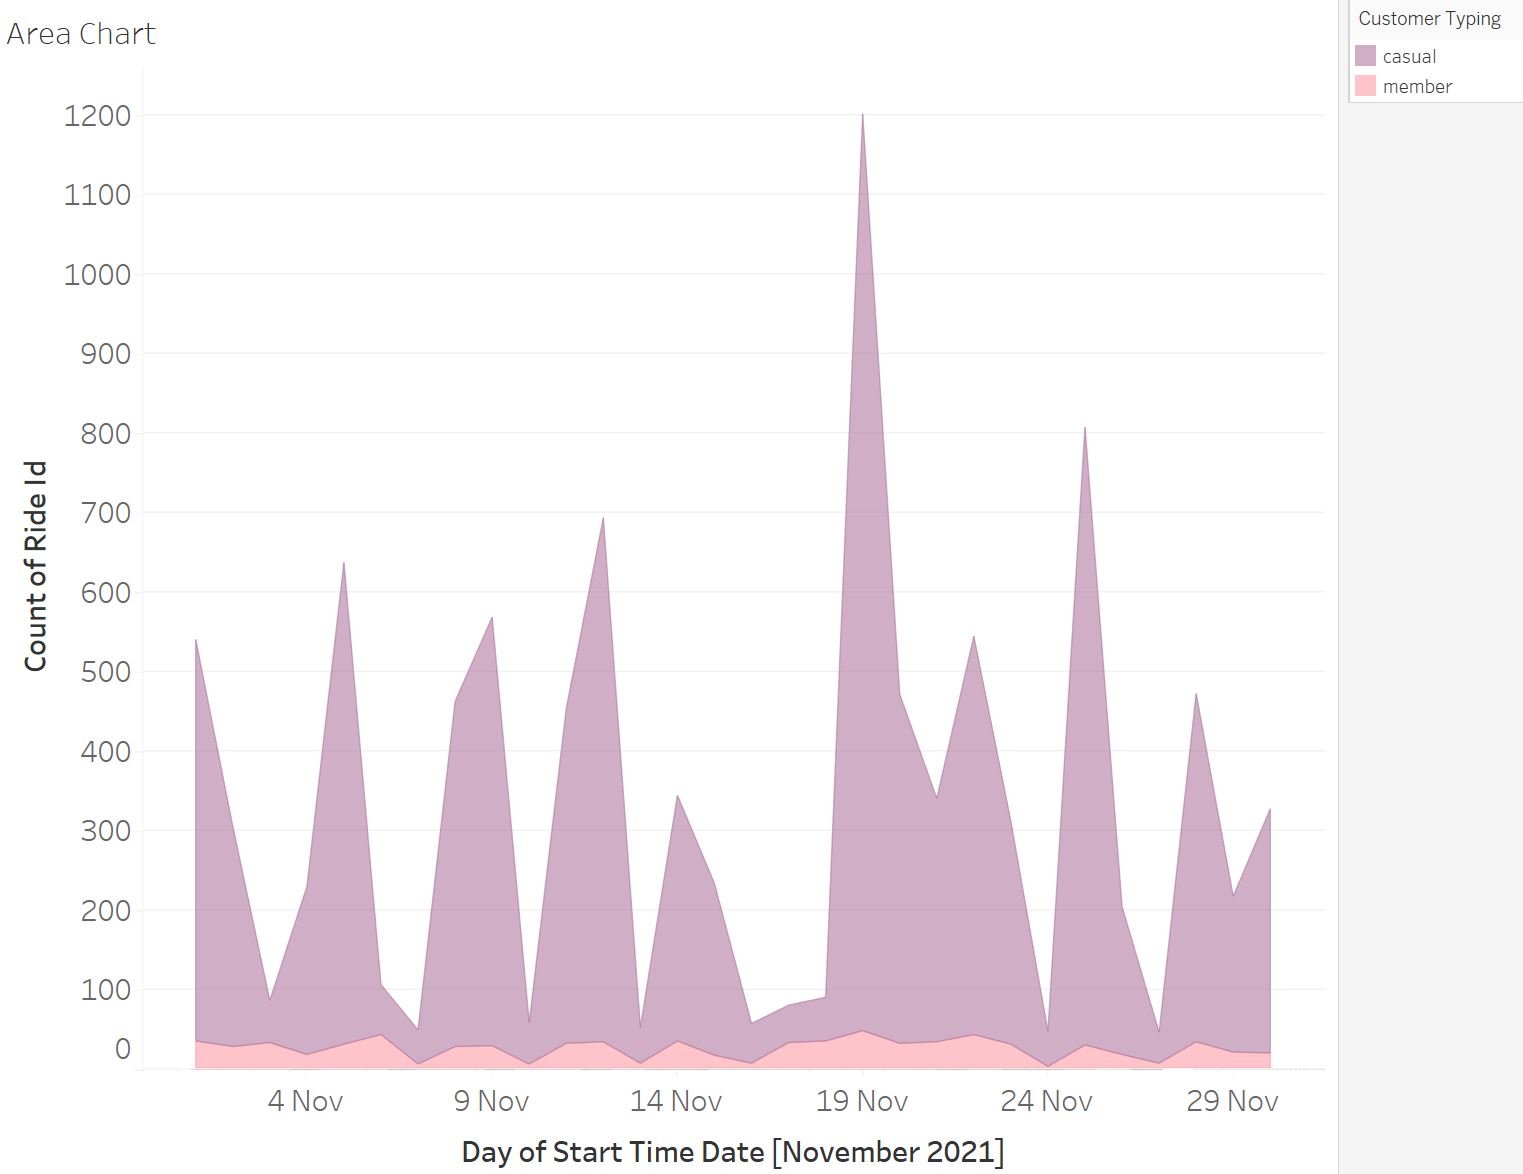
Area charts
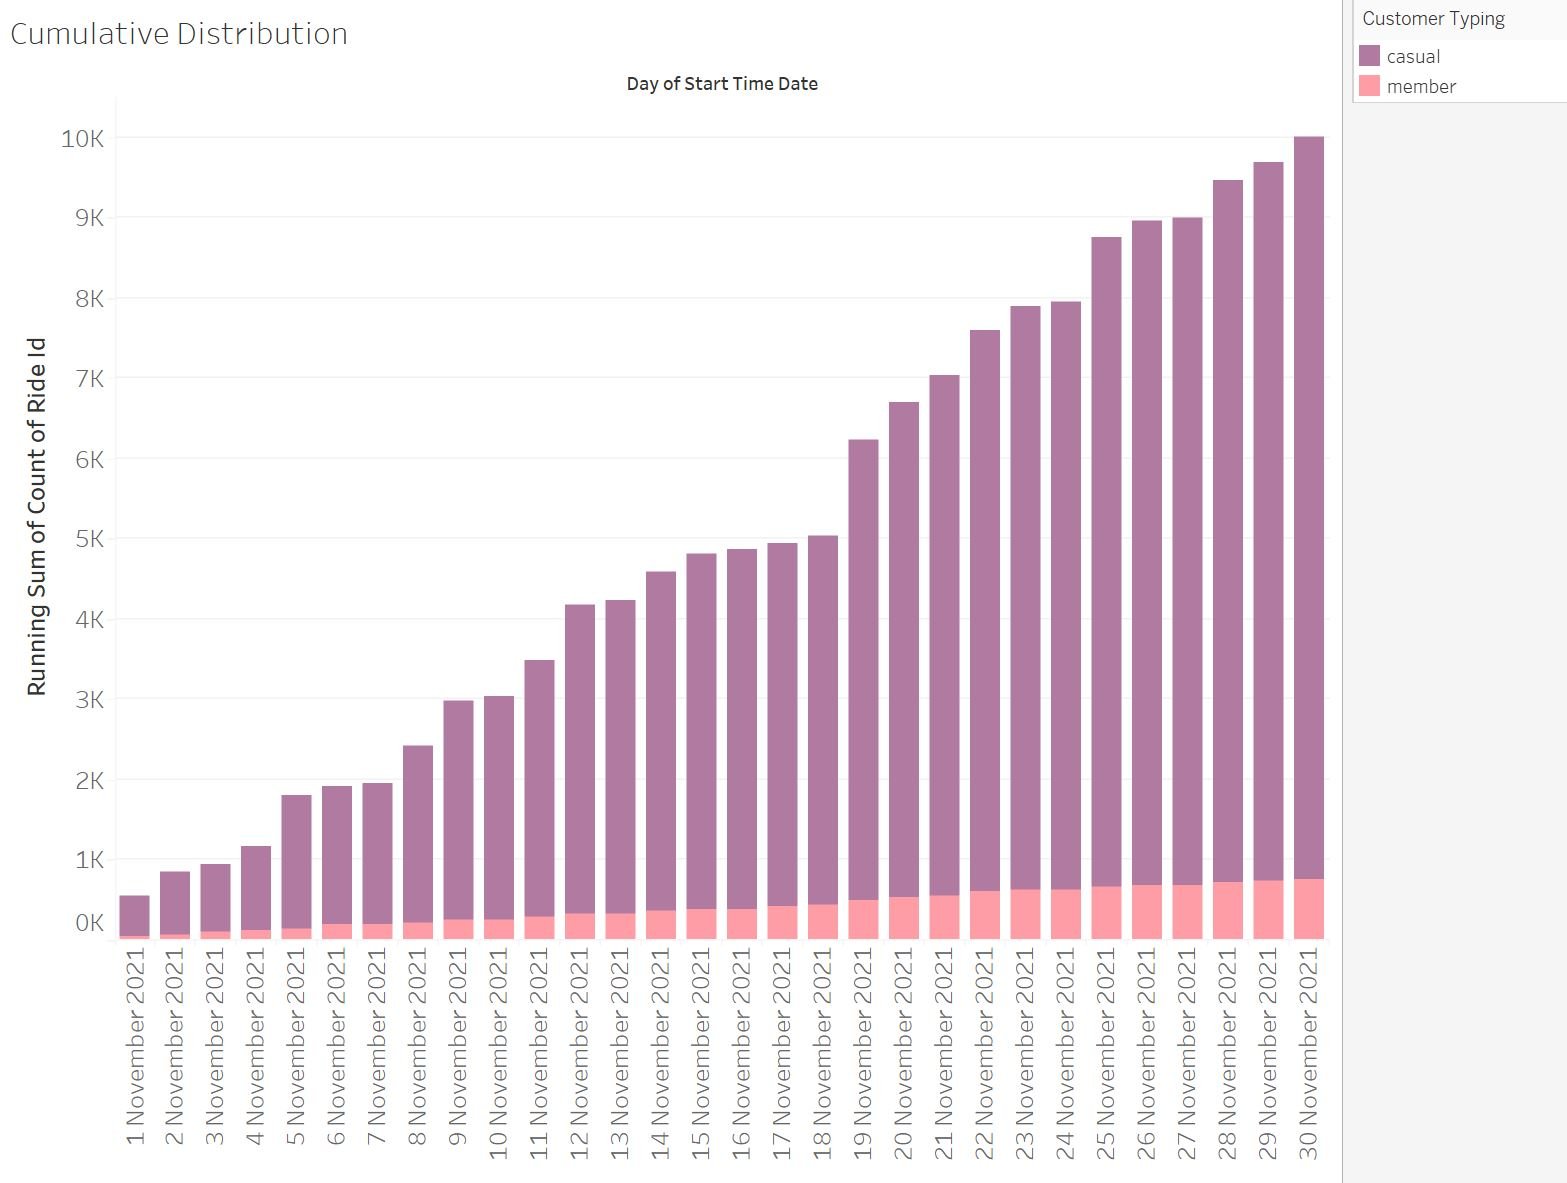
Cumulative distributions
Line charts